
Everything You Need to Know About Heikin Ashi Candles
5 min read · · Korean original
Contents 8
Did you know there are different kinds of candles? There's a way to spot the real trend in the market more easily: using Heikin Ashi candles.
Heikin Ashi candles are a type of candlestick that filters out unnecessary market volatility and shows the bigger picture more clearly. In this post, we'll look at what Heikin Ashi candles are, how they differ from regular candles, and how to use them in real trading.
Key Takeaways
- Heikin Ashi candles use average prices to show a smoother price flow than regular candles.
- Their strength is that they make trends easy to identify
- Better suited to mid- to long-term trend trading than to short-term trading
1. What Are Heikin Ashi Candles?
Heikin Ashi is a chart analysis technique that originated in Japan, developed by the legendary 18th-century trader Munehisa Homma. In fact, he's the one who created the original candlestick chart. You could say Heikin Ashi is a refined, upgraded version of it.
A Heikin Ashi chart looks similar to a regular candlestick chart, but because it averages out prices, it reduces market noise and shows trends more clearly. Simply put, it makes the overall movement of the market easier to see.
2. How Does Heikin Ashi Draw the Chart?
At this point, you're probably wondering how Heikin Ashi differs from regular candles. What formula does Heikin Ashi use that lets it show trends better?
The key lies in the "average." Heikin Ashi's close and open are calculated from the average of prices and of the previous candle. Meanwhile, for the high and low, all the prices shown in that candle are compared, and the highest becomes the high and the lowest becomes the low.
In short, Heikin Ashi candles don't follow simple price movement; they follow the average price. In other words, the goal is to show how the market is moving on average.
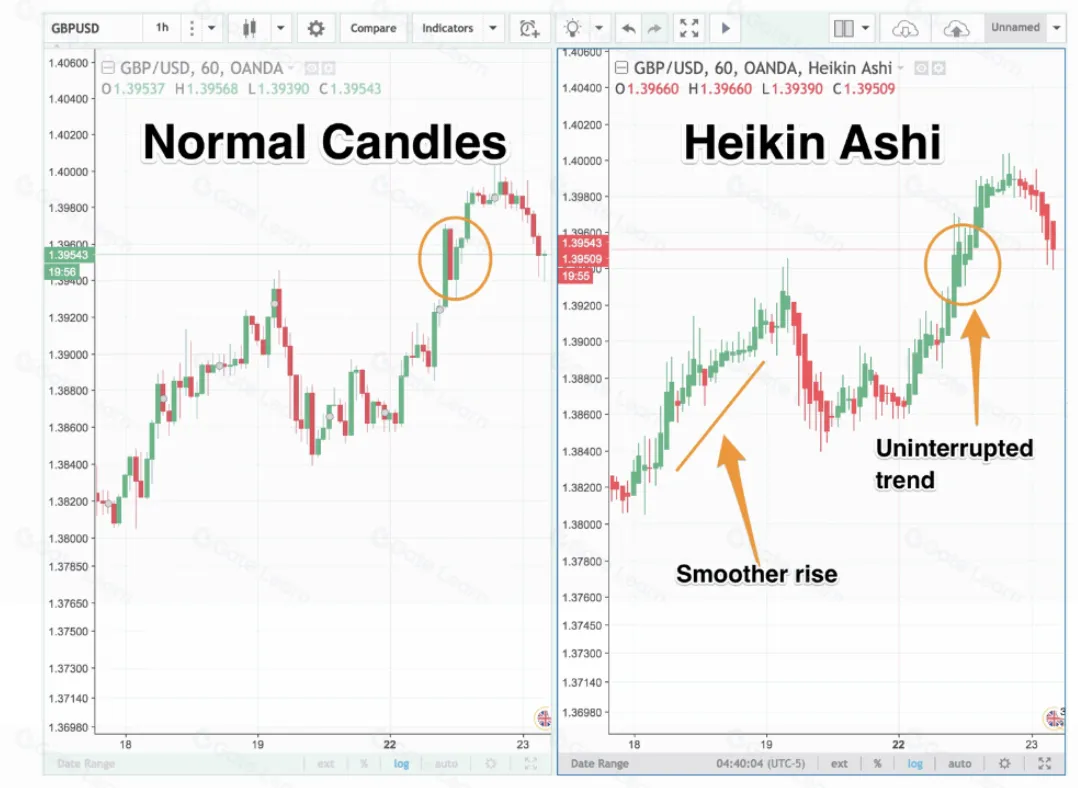
Features and Advantages of Heikin Ashi Candles
That's why Heikin Ashi candles are great for identifying the overall trend of the market. Because they use averages rather than simple price movement, they have the advantage of greatly reducing the noise caused by market volatility.
For example, with regular candles, if the price rises it's always a bullish candle, and if the price falls it's always a bearish candle. But since Heikin Ashi draws candles using averages, candles of the same color often appear in a row along with the trend.
Also, the price gaps that appear on regular candles don't show up on Heikin Ashi. As a result, it greatly reduces the confusion caused by price volatility within a single candle.
Disadvantages of Heikin Ashi Charts
Of course, Heikin Ashi has its drawbacks too. The main one is that it differs from the actual price. Because candles are drawn from averages, they can differ from the market price. This can make it inconvenient to see exact buy and sell prices.
Also, Heikin Ashi may not be suitable for those who mainly do gap trading, because Heikin Ashi candles have no gaps at all.
Finally, because Heikin Ashi derives its averages by referring to previous price movements, it may not be useful for chart analysis on short time frames, or for scalping and day trading.
Heikin Ashi candles greatly reduce unnecessary noise, but on the other hand, they have the drawback that entry and exit signals can come too late when a new trend begins. That makes them better suited to swing trading and long-term investing on longer time frames.
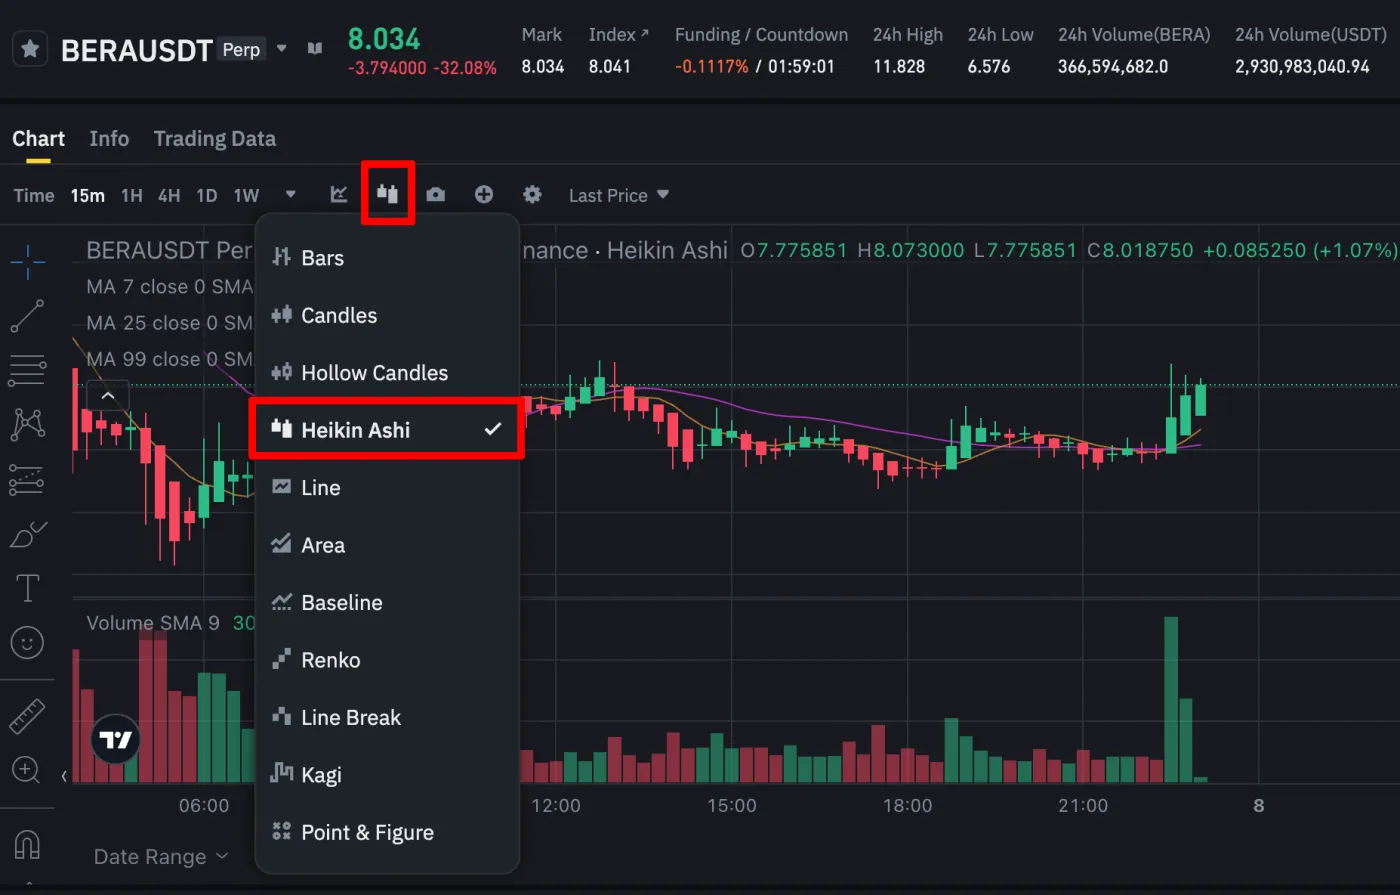
How to Set Up Heikin Ashi Candles
You can set up Heikin Ashi candles in the option for changing the candle type. Go to Binance, Bybit, or TradingView, then select Candlestick → Heikin Ashi. Your existing candlestick chart will switch to a Heikin Ashi chart.
How to Use Heikin Ashi Candles in Trading
Lastly, let's look at how to use Heikin Ashi candles in real trading. The important point here is that Heikin Ashi candles are suited to swing trading from a mid- to long-term perspective. So it's best to use Heikin Ashi to build long-term positions rather than short-term ones.
1. Strong Uptrend and Buying Opportunities
When bullish candles appear in a row with almost no lower wicks, it means strong buying pressure is behind the move. In this case, you can consider holding your long position or buying more.
2. Possible Trend Reversal
Be careful when Heikin Ashi candles get smaller and show long upper and lower wicks. Since the trend may be reversing, you may need to close existing positions or manage your risk.
3. Strong Downtrend and Selling Opportunities
When bearish candles appear in a row with almost no upper wicks, it means strong selling pressure is behind the move. In this case, you can consider holding your short position or selling more.
Using Heikin Ashi with Technical Indicators
Heikin Ashi candles are more useful when used together with technical indicators such as moving averages, RSI, and volume rather than on their own. If you're planning trend-following trades from a long-term perspective, Heikin Ashi can help you cut through market noise and grasp the overall movement of the market more easily.


