Shuka on Technical Analysis and the "Kiyoung" Trading Method, Summarized
4 min read · · Korean original
Contents 11
Let's look at the principles behind the "Kiyoung chart" as explained by Shuka.
I don't think anyone else explains technical analysis this simply while making it this much fun.
The full video is at the bottom.
1. Understanding Technical Analysis
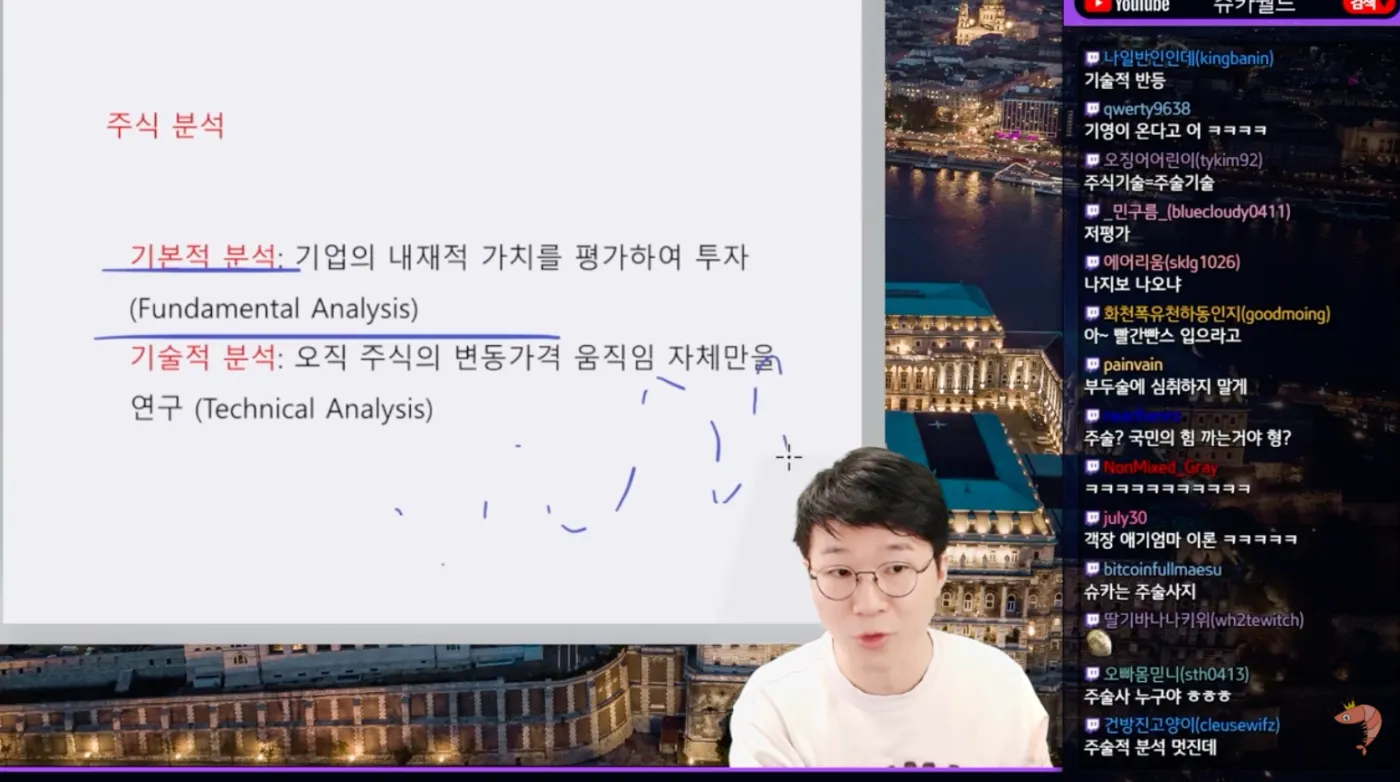
Investment analysis comes in two types: fundamental analysis and technical analysis.
Technical analysis is a method of predicting prices based on charts.
This is different from fundamental analysis, which predicts prices based on a company's intrinsic value.
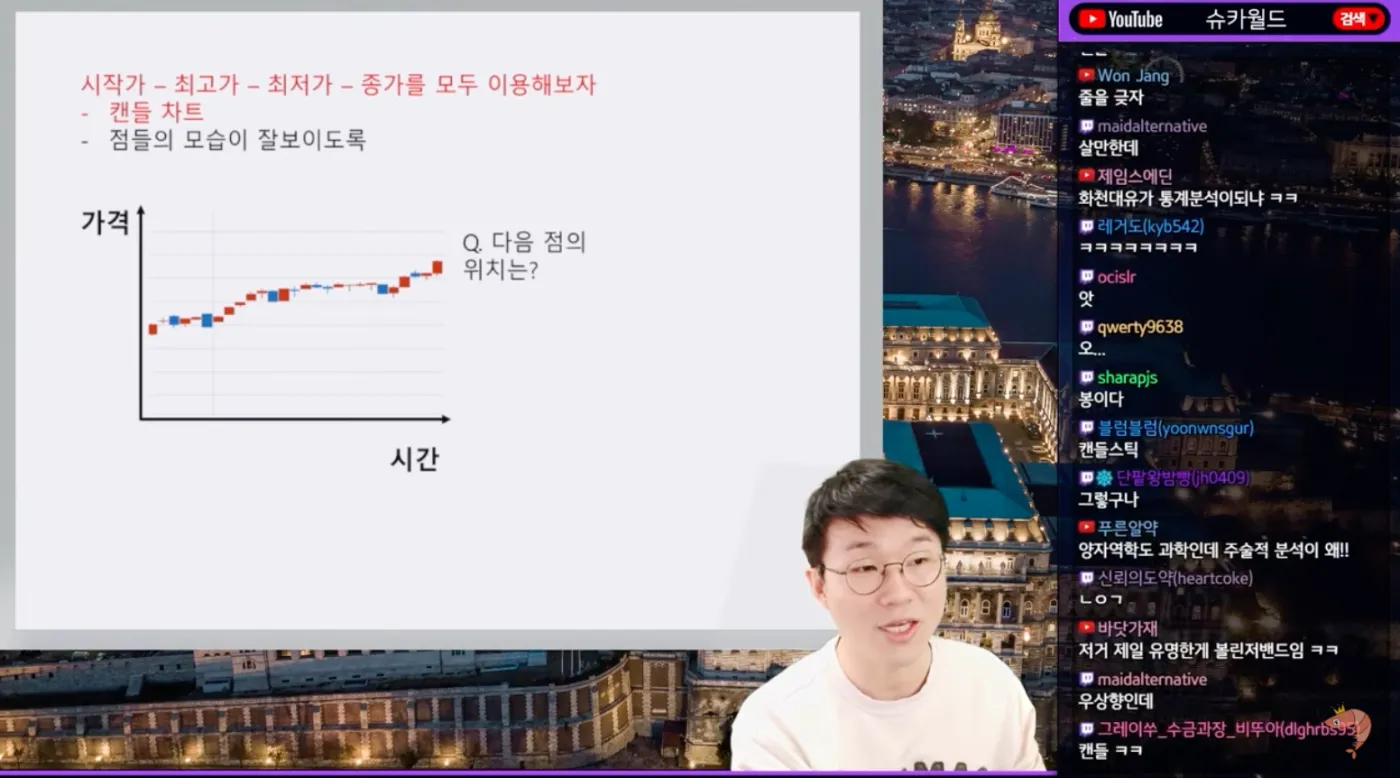
A chart basically shows price changes as candles.
Technical analysis tries to predict the next price move.
How?
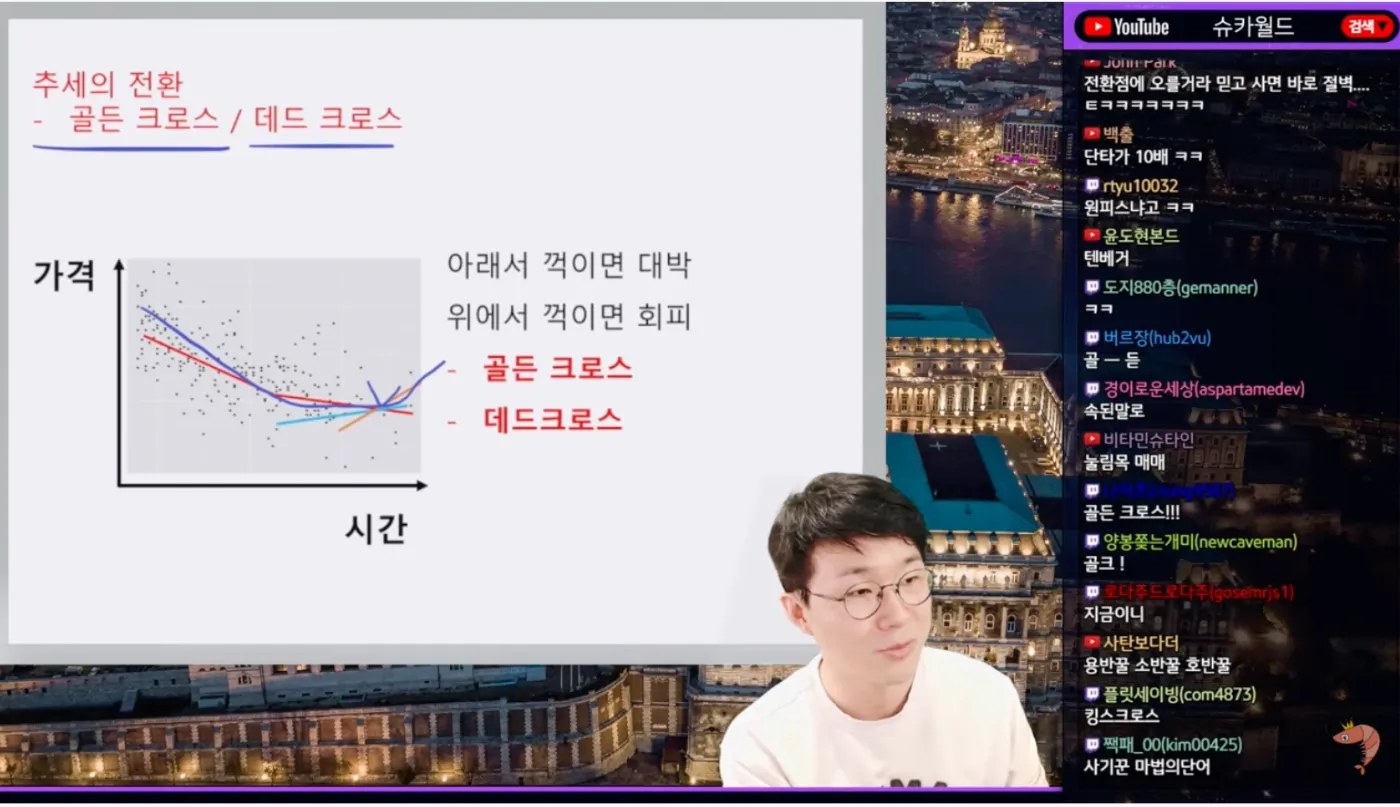
The most common method is the moving average.
The golden cross and the death cross we often hear about are both analysis methods based on moving averages.
The textbook move is to buy on a golden cross and sell on a death cross.
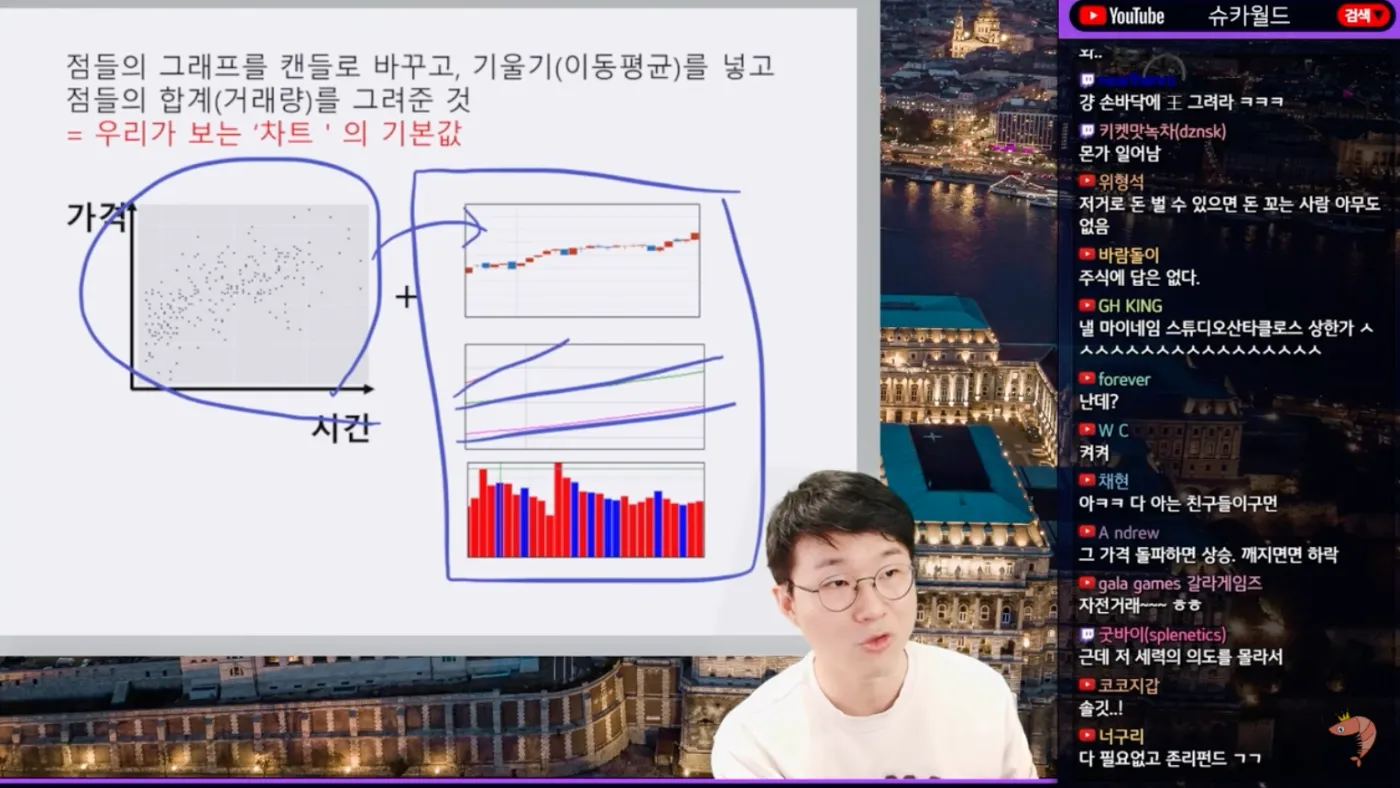
Finally, add trading volume over time and you get the chart we usually see.
2. Enter the Bollinger Bands
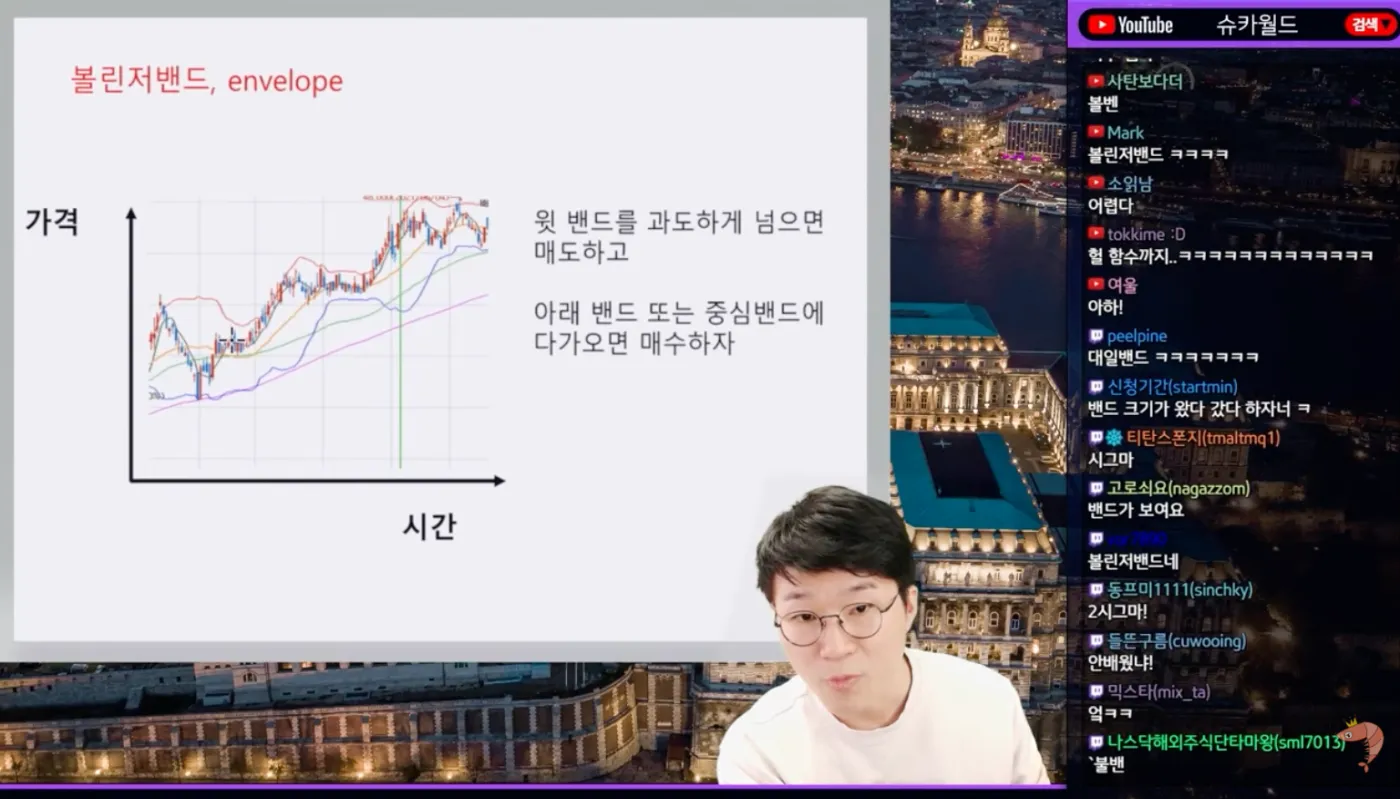
A well-known secondary indicator is the Bollinger Bands.
The strategy draws an upper band and a lower band around a moving average, then sells when the price touches the upper band and buys when it touches the lower band.
In practice, most price movement does stay inside the bands.
But there are also plenty of times when the price breaks through the bands.
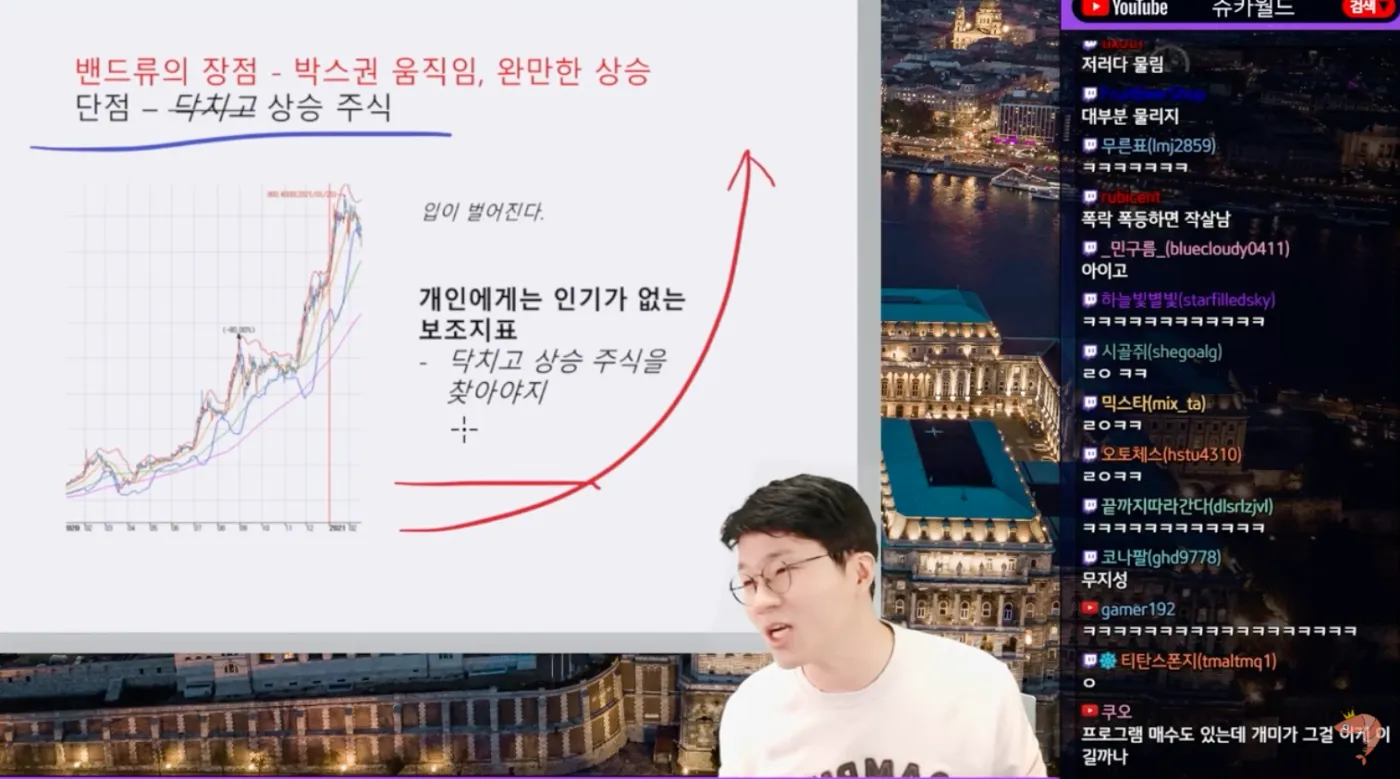
3. The Kiyoung Method, a.k.a. Pattern Analysis
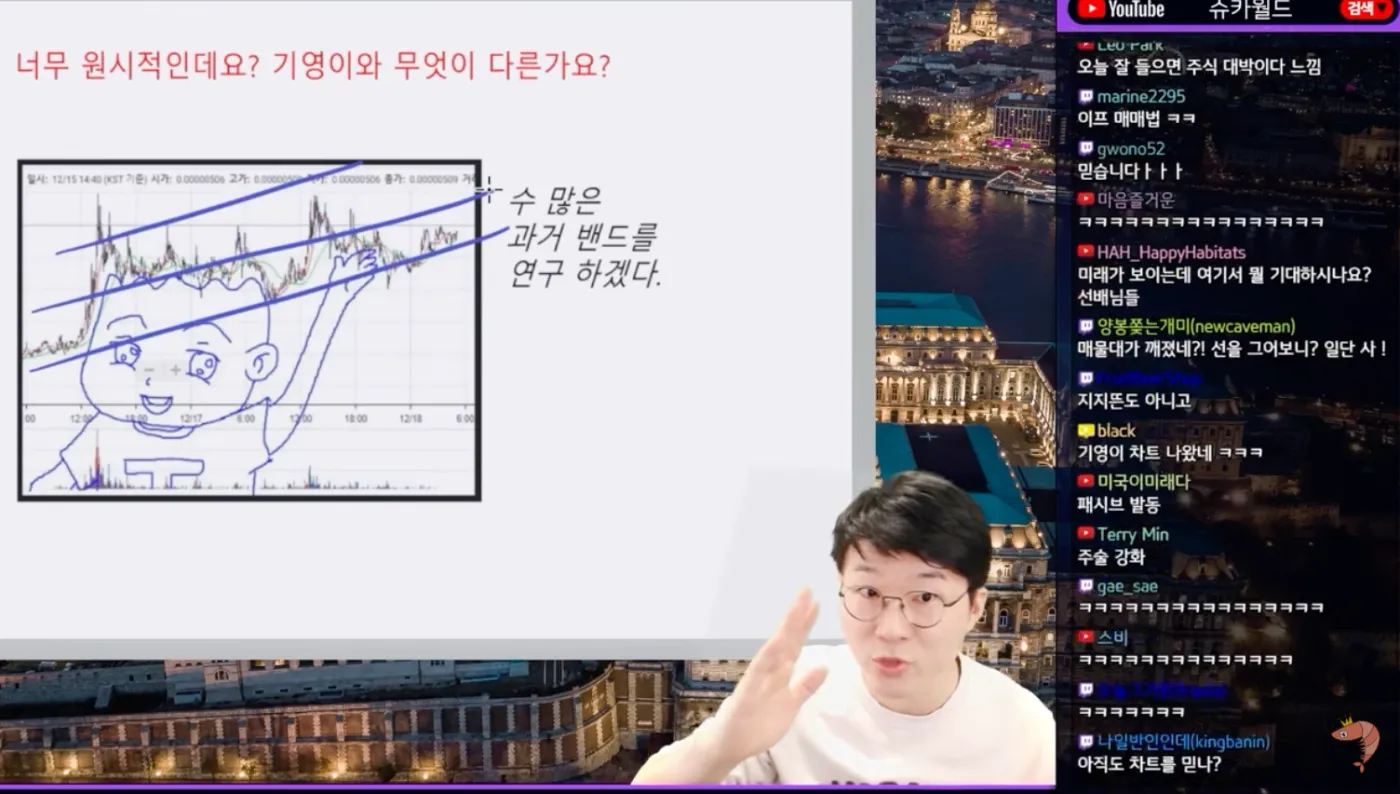
The Kiyoung method is just for fun. What it really does is apply patterns like the ones below.
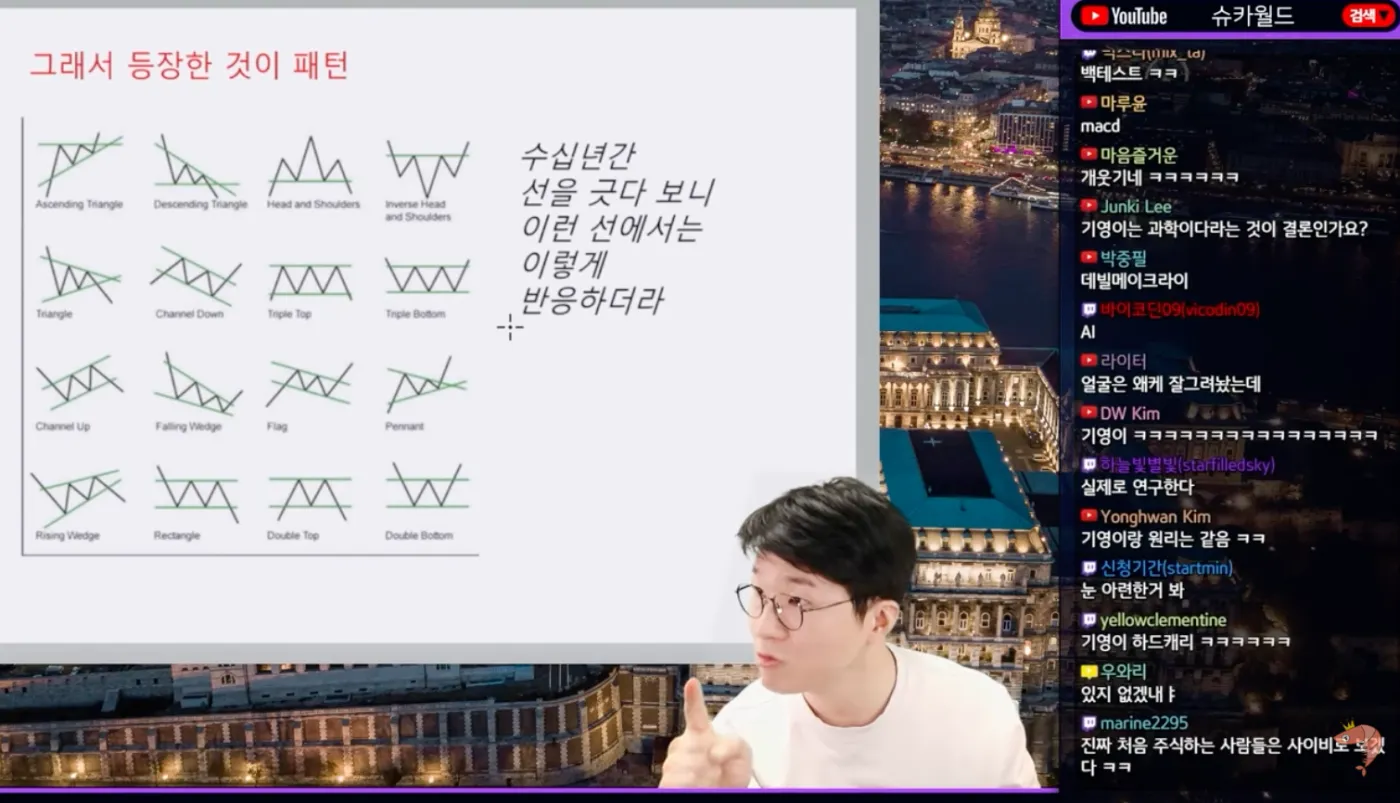
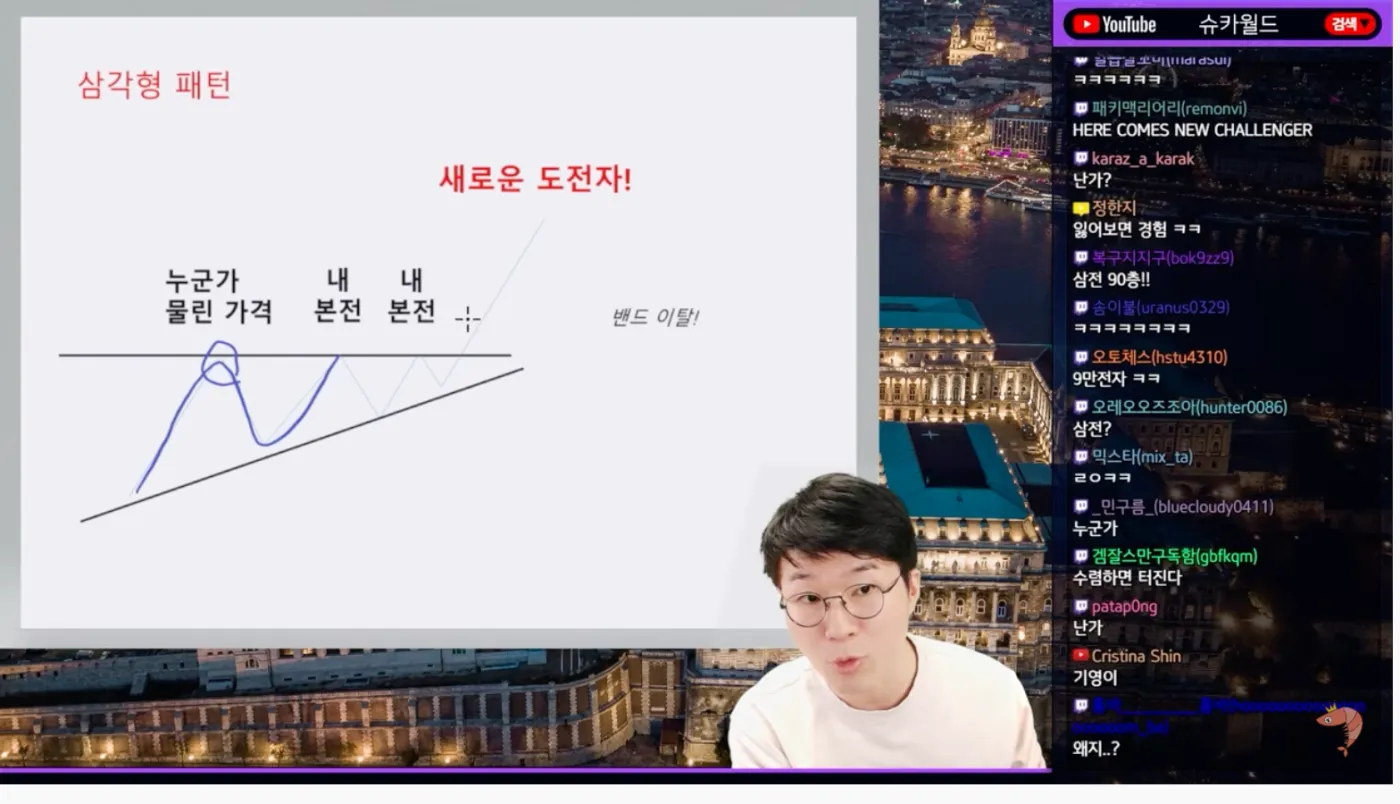
To give one example, the ascending triangle pattern, where a resistance line forms and the price then breaks through it and rises, takes shape like this.
And then there's the head and shoulders pattern, known for shaking out retail investors.
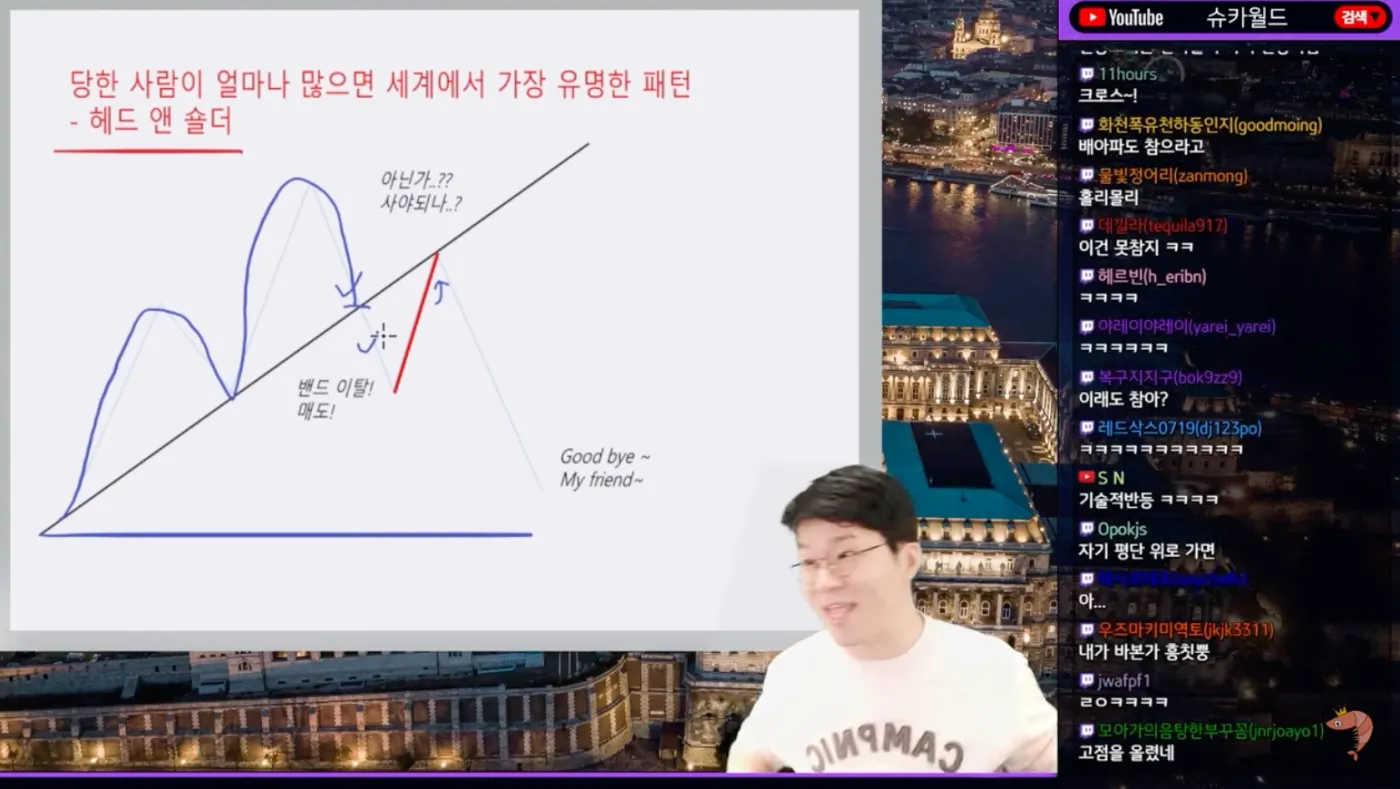
It goes "Up or down?" for a while, lures retail investors in at the top, and then drops.
4. The Strengths of Technical Analysis
The strength of technical analysis is that your stop-loss and take-profit(?) lines are clear.
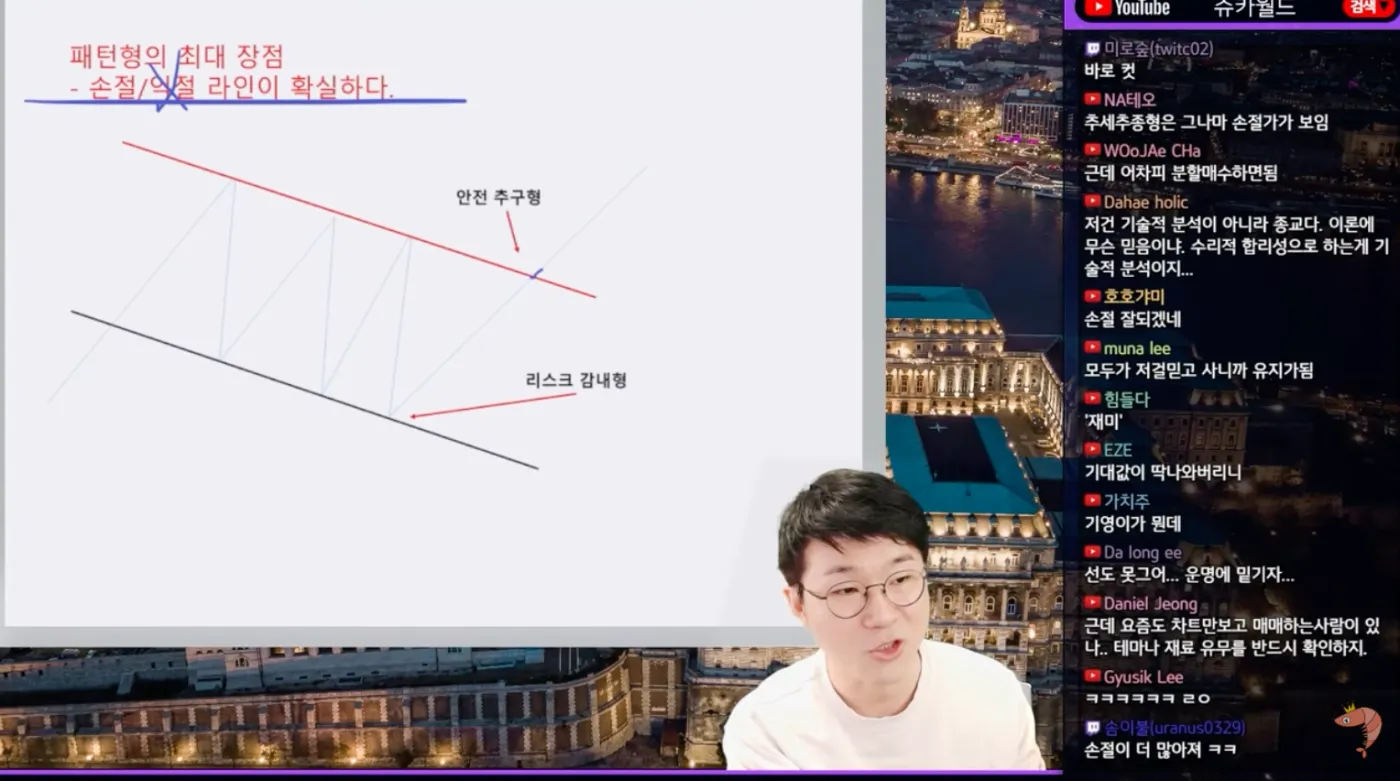
Technical analysis works better when combined with fundamental analysis.
To hold on when the price falls below the bottom you picked, you need conviction grounded in fundamental analysis.

5. Hyman Minsky's Analysis
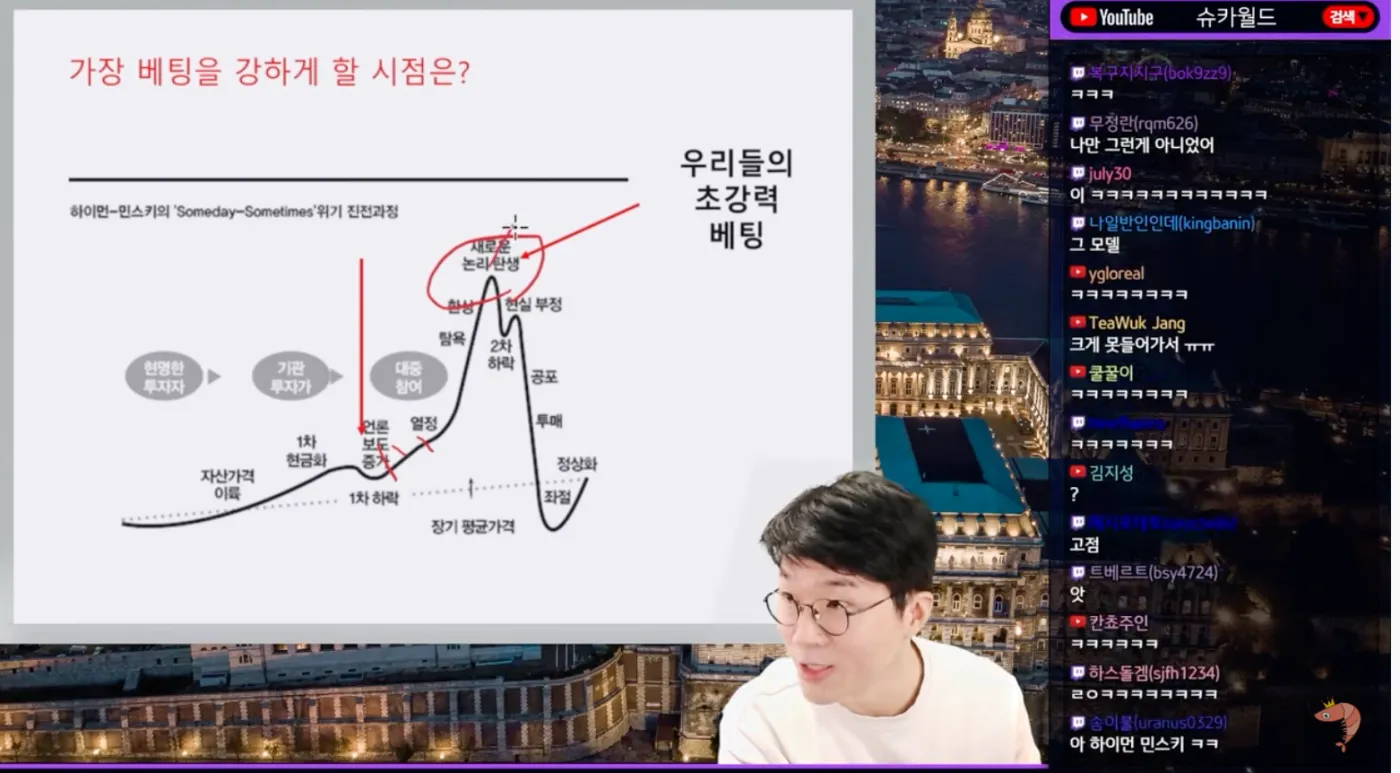
According to this model, we usually go all in when a new narrative is born.
6. MACD
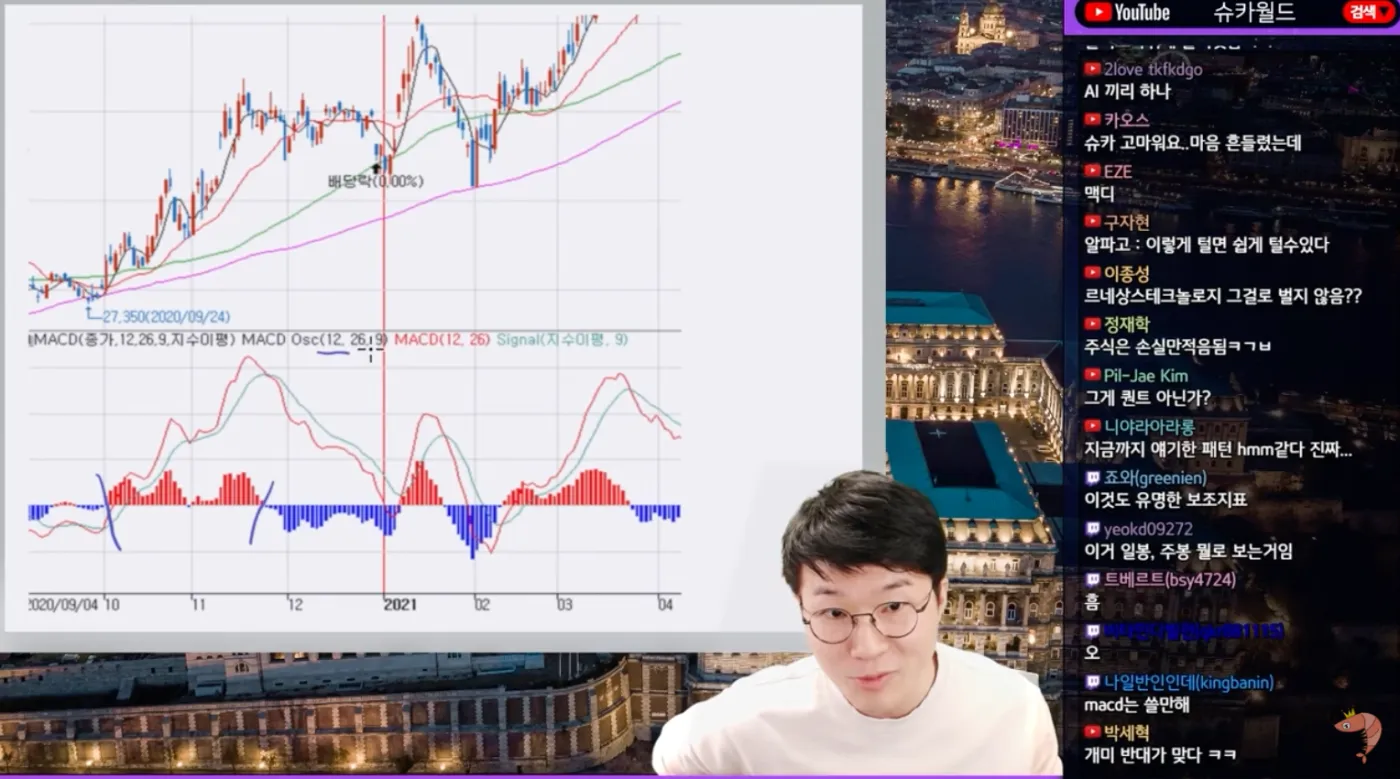
Moving Average Convergence Divergence.
It's a secondary indicator built on moving averages.
For reference, a moving average is a line drawn by averaging price movements over a past period.
You can consider the MACD's turning points as times to buy or sell.
7. Charts as Lagging Indicators, and Backtesting
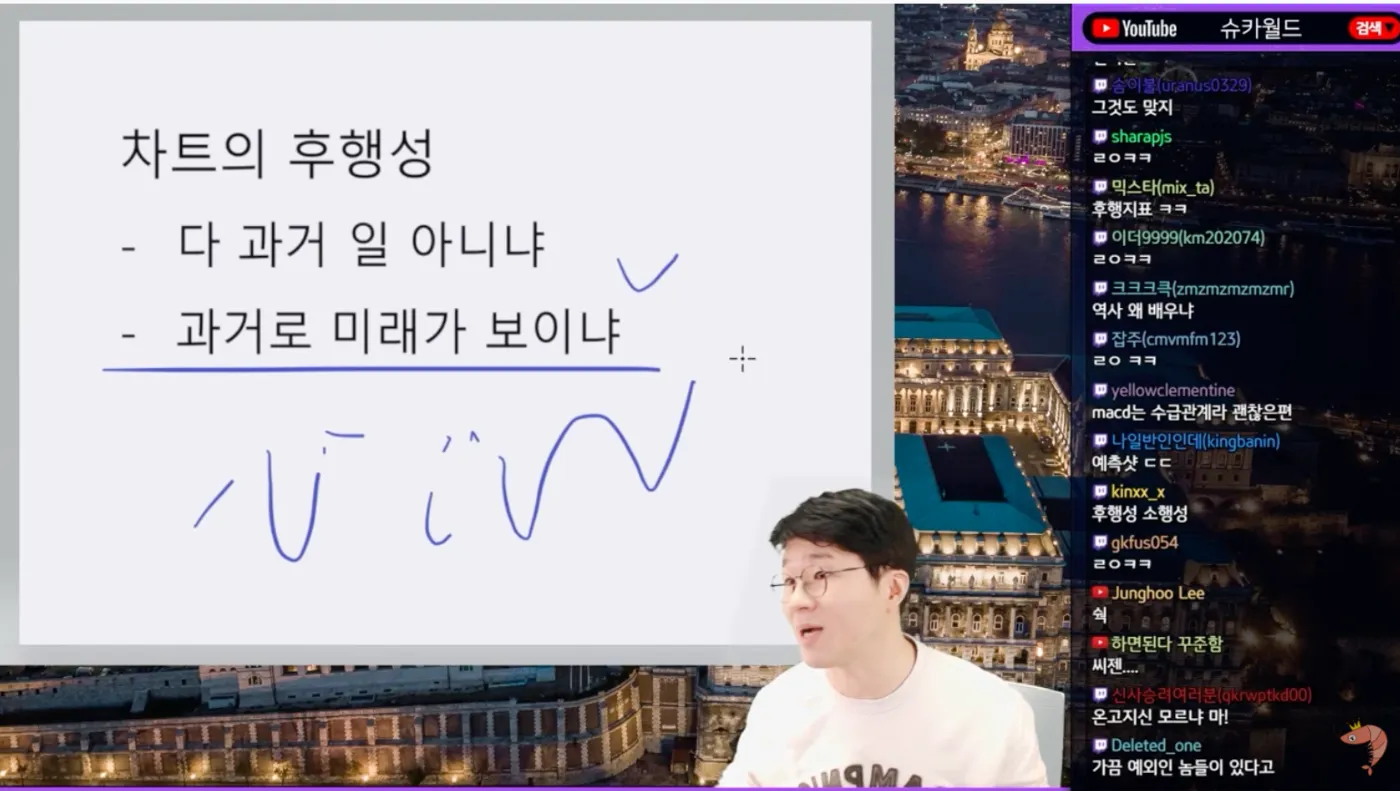
But aren't charts all lagging indicators?
How can they tell us the future?
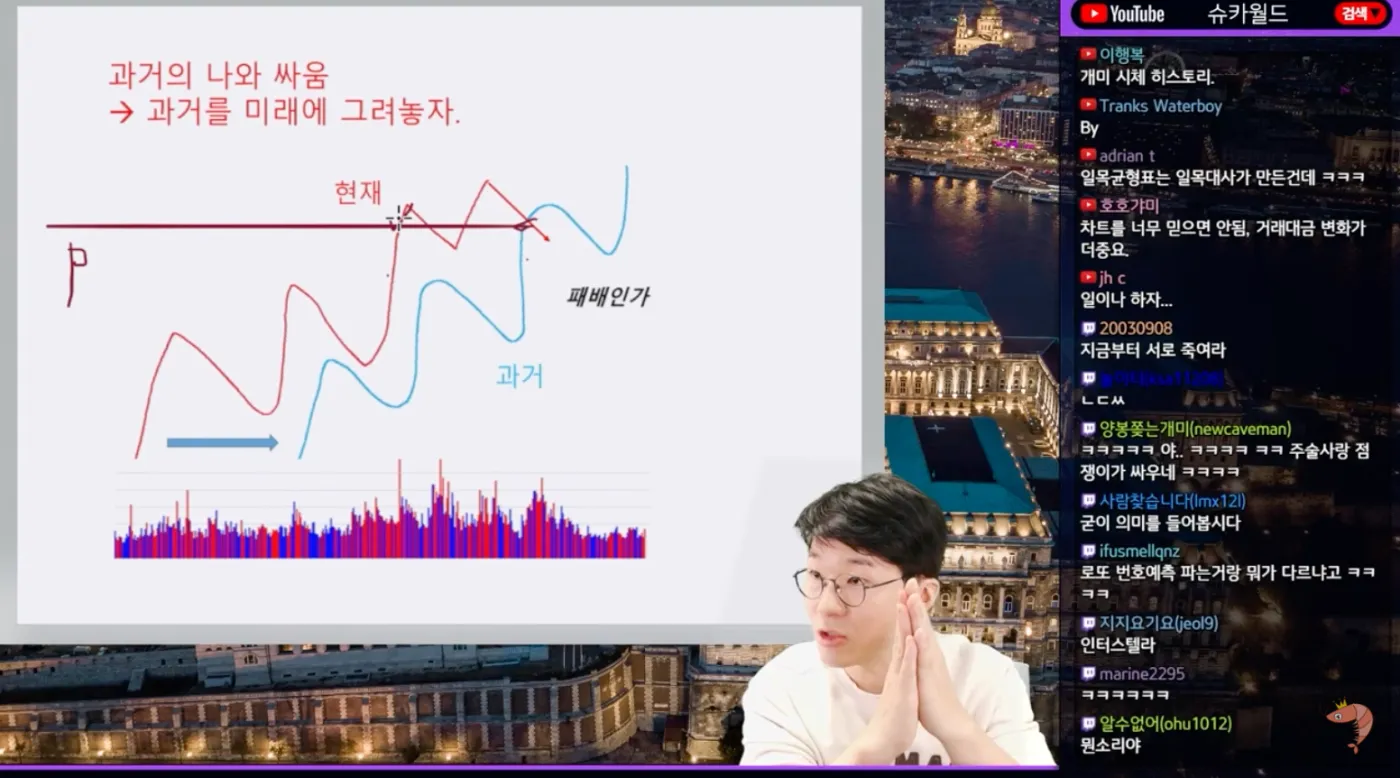
They can't.
That's where backtesting with past data comes in.
In the end, technical analysis is a game of probabilities.
8. Ichimoku Cloud
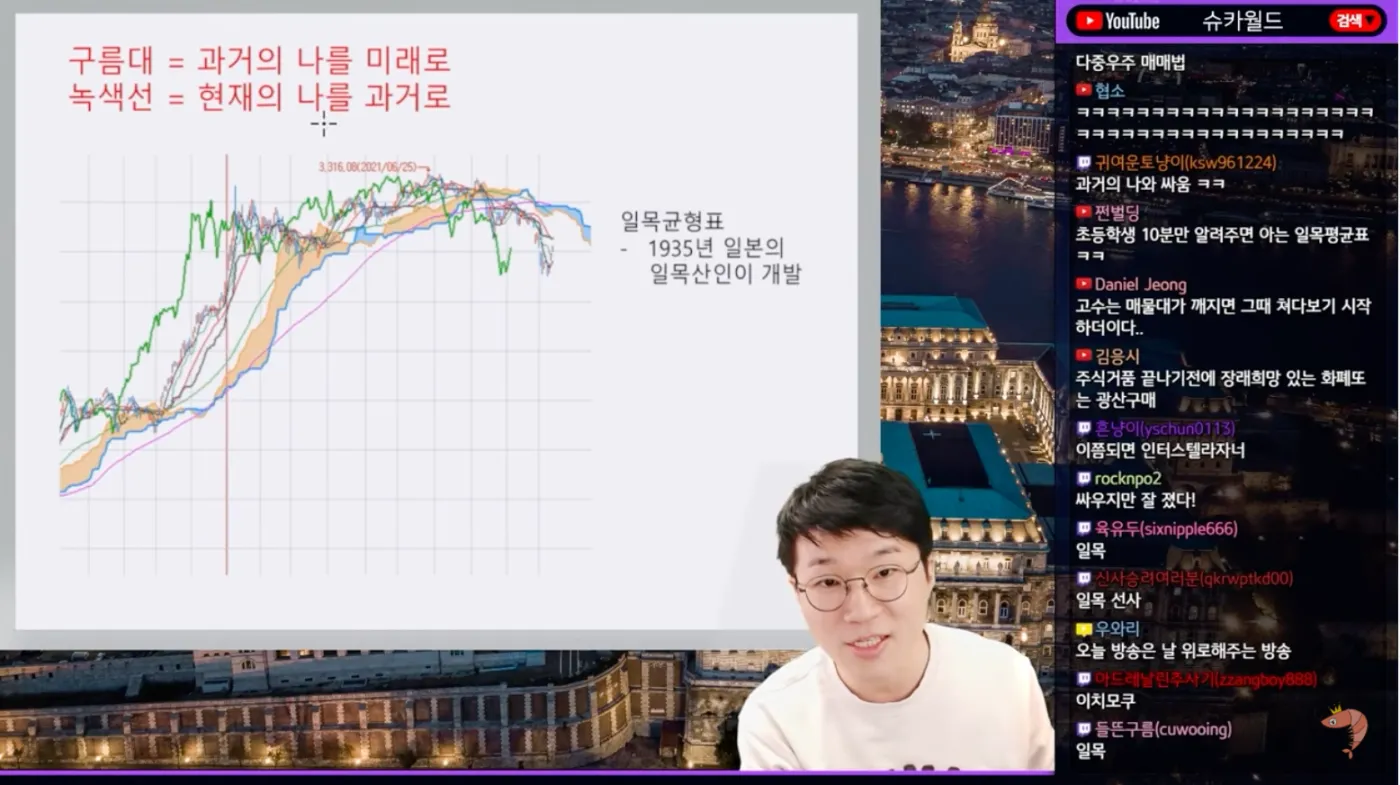
The Ichimoku Cloud is fairly popular with individual investors, but Shuka only touched on it in a fun way, maybe because he thought it would be a bit hard to explain.
In short, it's an analysis that predicts price movement using various lines and a cloud (the conversion line, the base line, and the leading and lagging spans).
You can find a detailed explanation in Binance Academy's guide to the Ichimoku Cloud.
9. Candlestick Analysis
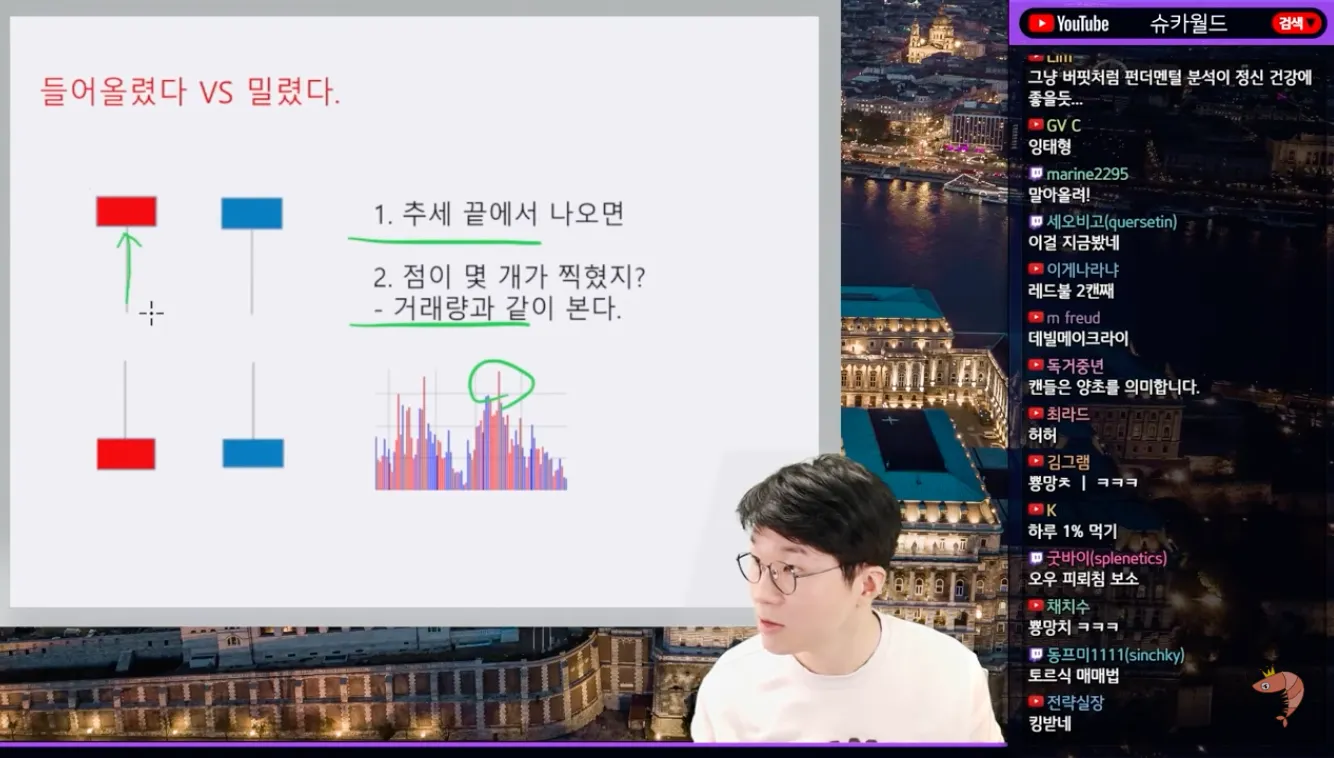
Candles tend to carry a lot of meaning at the end of a trend.
If it gets lifted up: "Look right here, see how it lifted up?"
If it gets hit and comes down: "Nope, see how it got hit by a sledgehammer and went down?"
In technical terms, these are called the hammer and the inverted hammer.
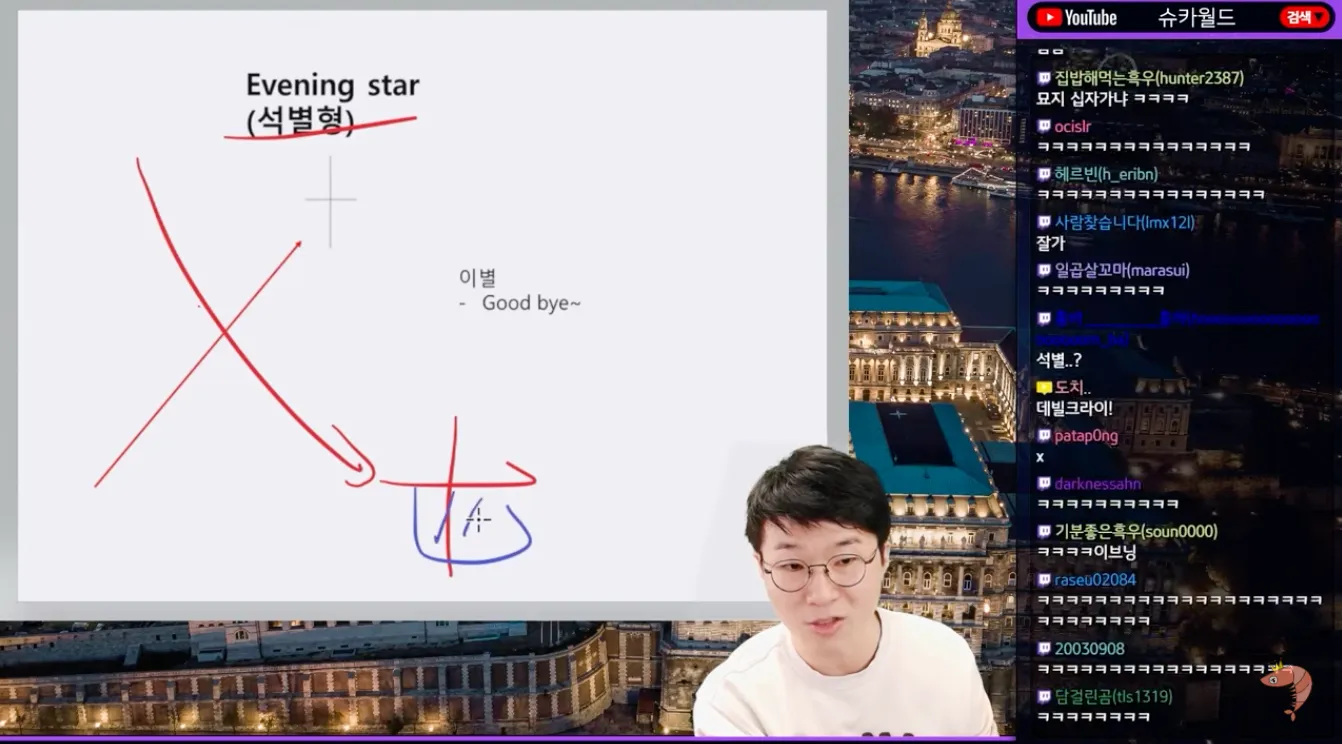
The doji candle signals a trend reversal. When you see a cross like that, be careful.
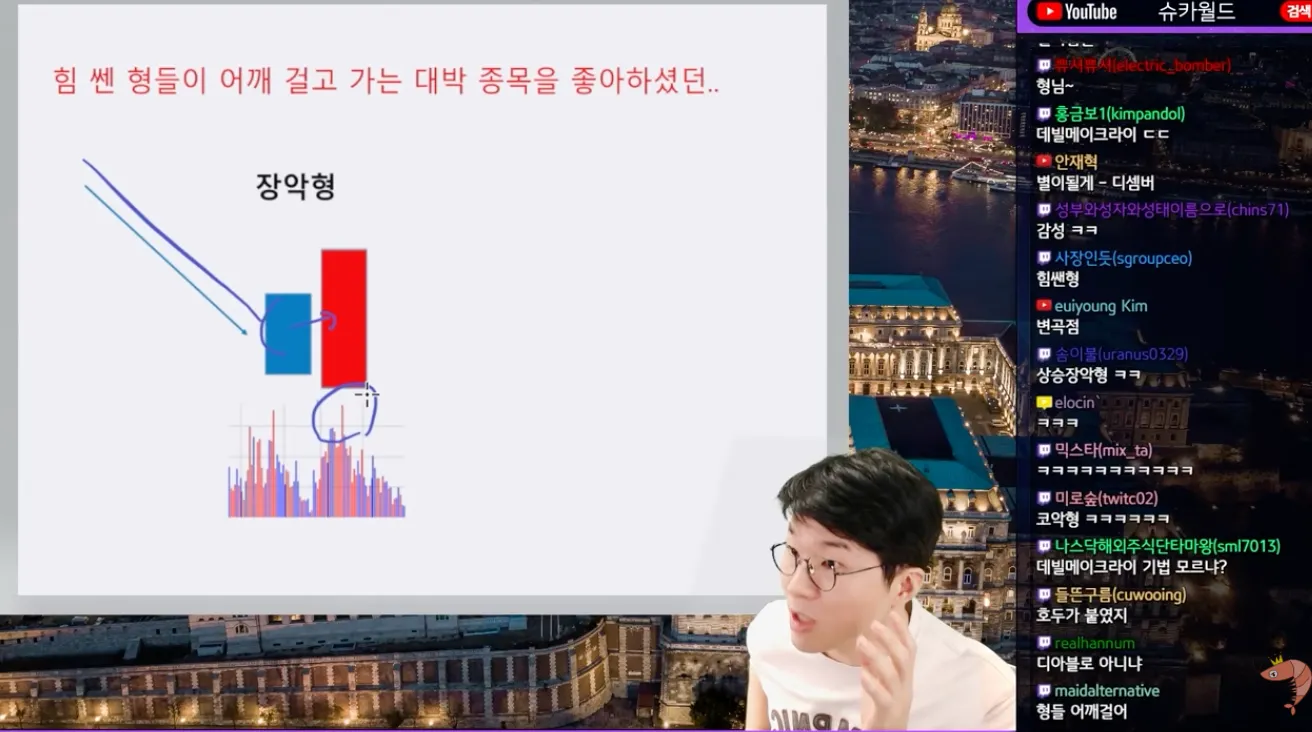
There's also the engulfing candle that appears during a downtrend.
If a long bullish candle appears that goes beyond the previous bearish candle, it's read as a reversal into an uptrend.
Of course, it may or may not turn out to be right ^^
10. RSI
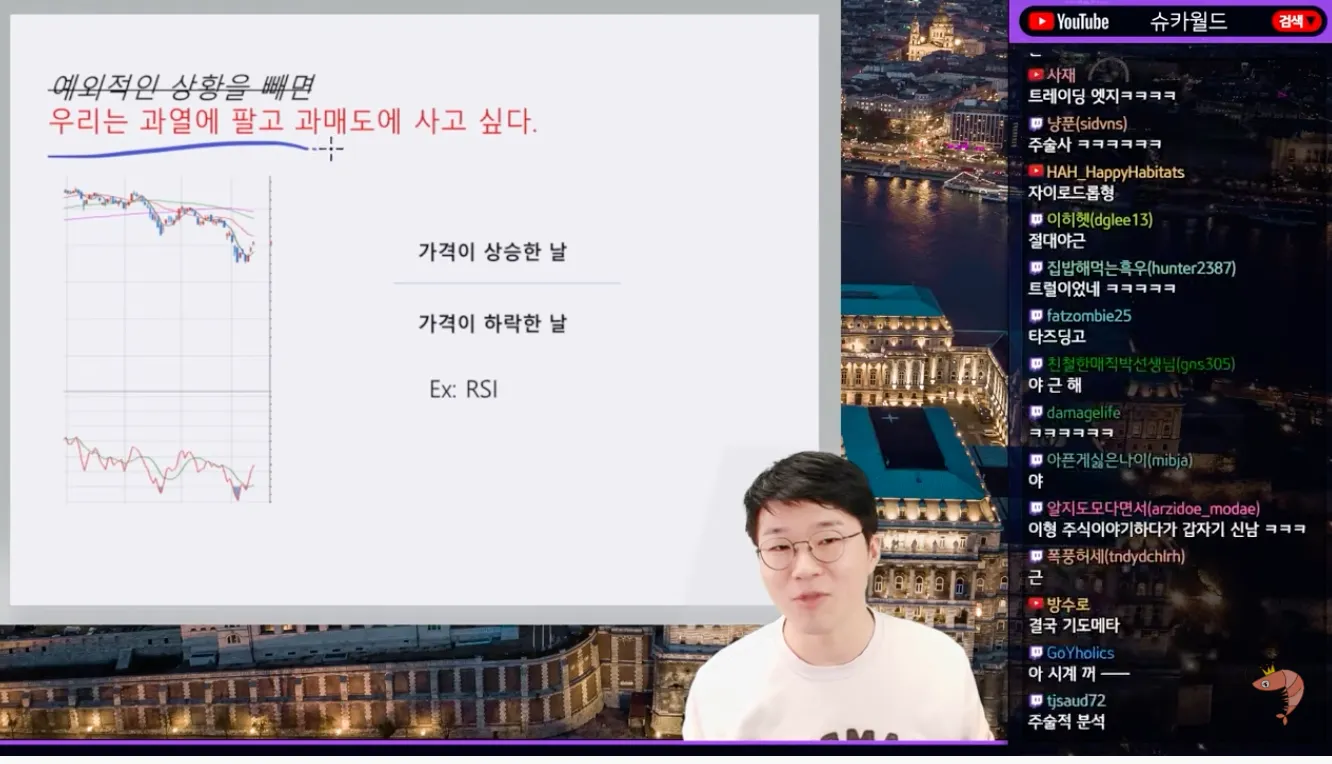
The Relative Strength Index, which gauges how overheated the market is.
I think it's an indicator that's both easy and hard, and one that may lead individual investors into contrarian trades.
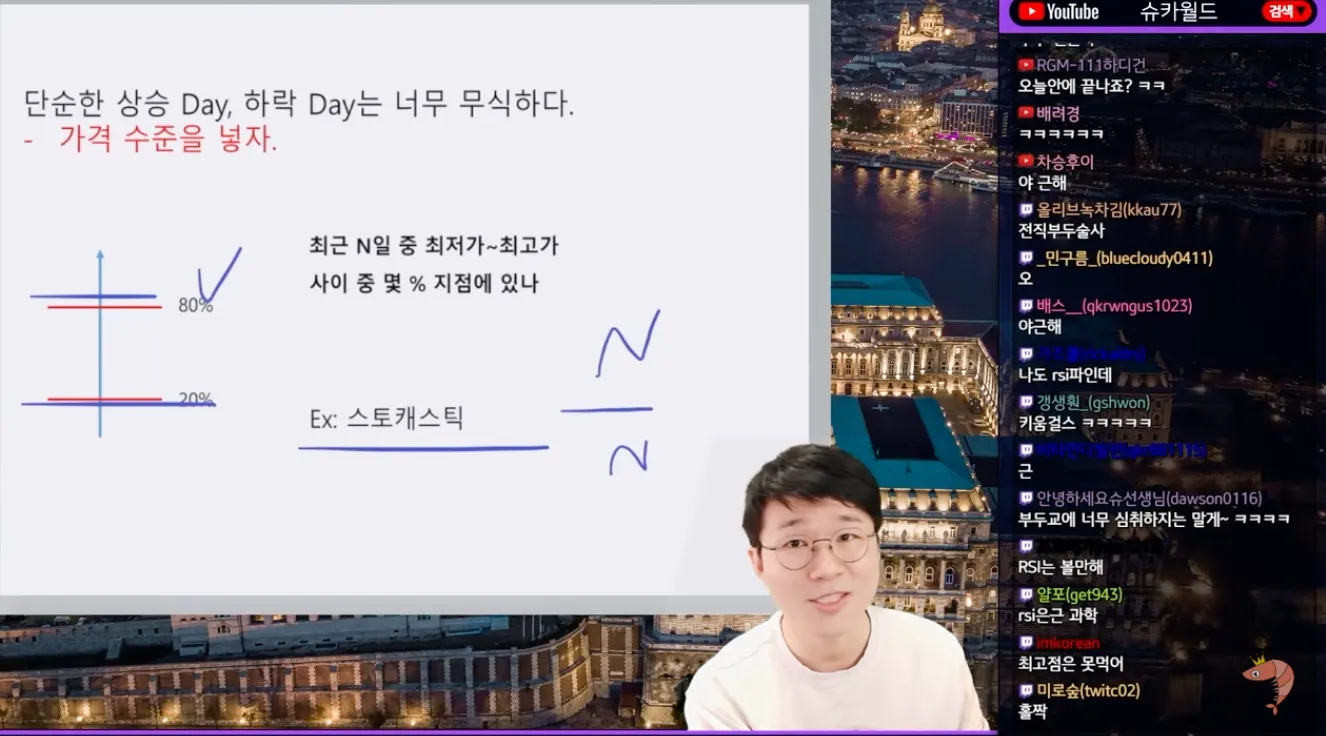
Stochastic RSI, which adds the price level into the mix.
11. Summary
The most important things are the slope, the candles, and the volume.
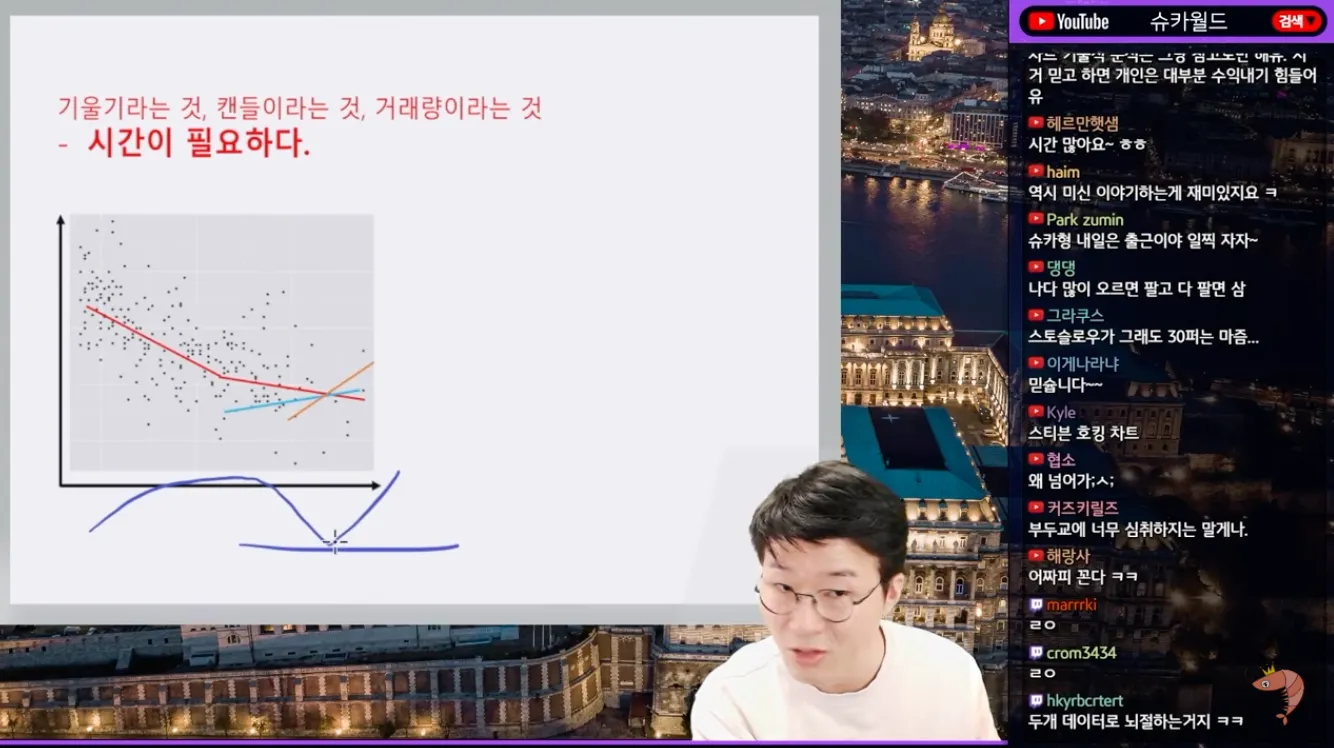
On top of that, add the timeframe of the analysis (1 minute, 5 minutes, 30 minutes, 1 hour, and so on).
You could say the longer the timeframe, the more reliable it becomes.
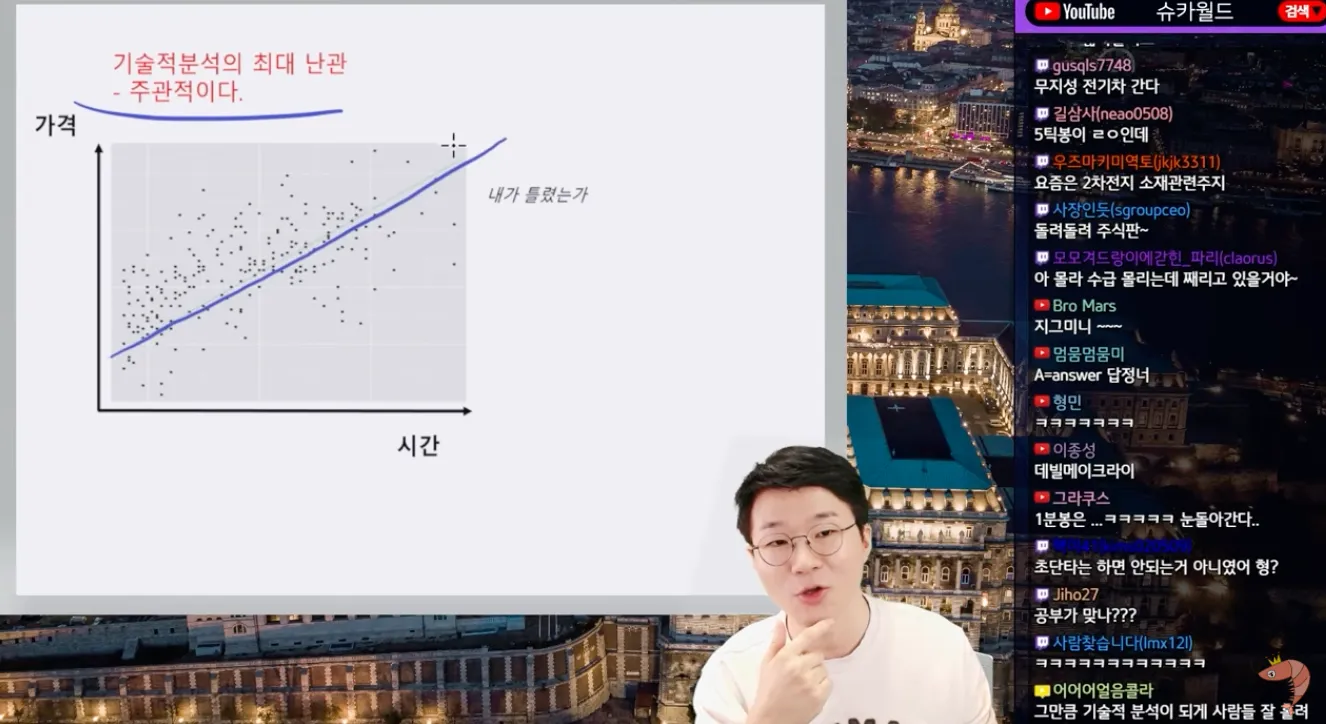
But this kind of technical analysis is subjective.
Everyone can read the same chart differently.

Technical analysis like this has both pros and cons.
Personally, I think technical analysis matters more in speculative markets like Bitcoin than in other markets,
but still, charts are only for reference.
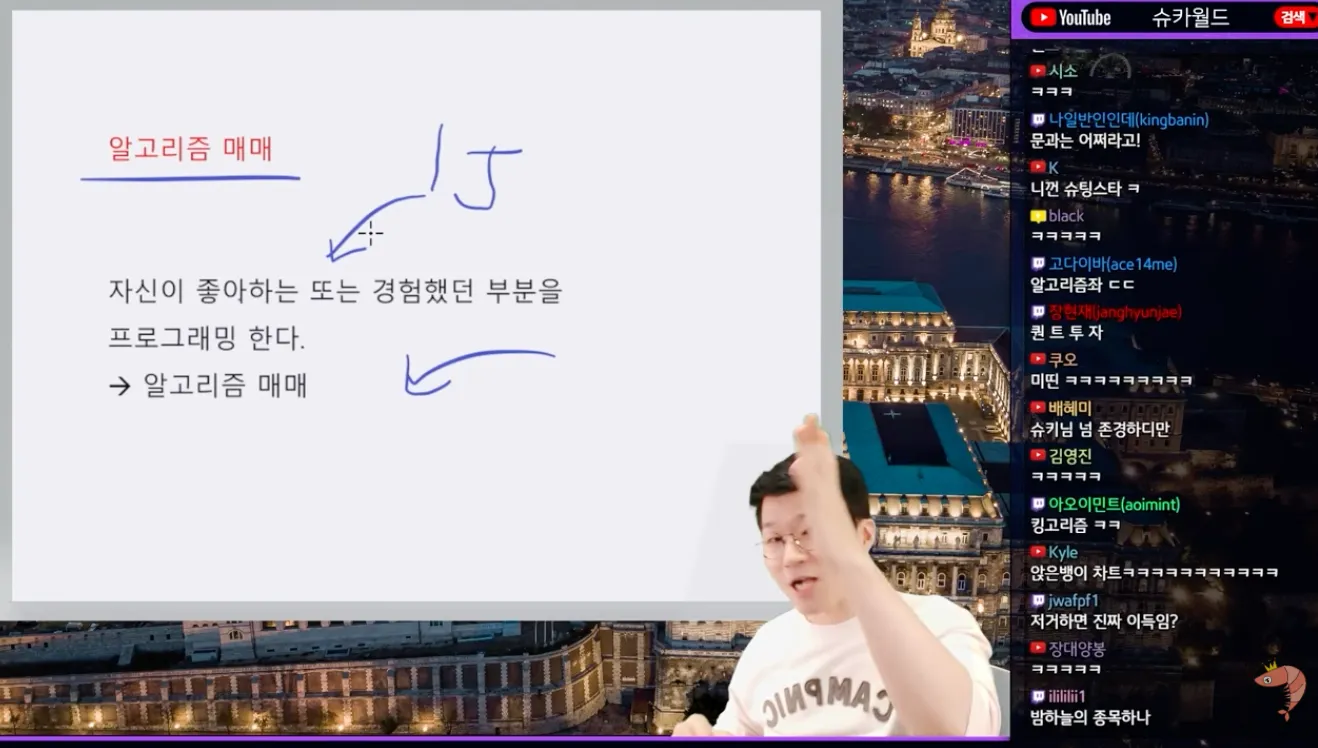
You can also write a program based on technical analysis and do algorithmic trading.
But think carefully before paying for one. If it made money that easily, why would they sell it? They'd keep it to themselves!
That's it. The full video is below.


