
Recommended Trading Indicators Explained: RSI, MACD, Bollinger Bands and More
4 min read · · Korean original
Hello, this is Bitpunk. Crypto prices sure have been going up and down a lot lately. Crypto traders use a variety of indicators when they trade, so let's take a look at 7 of the most popular technical indicators. These indicators can help you understand trends, trading volume, and how prices are moving. Alright, let's get started!

1. Relative Strength Index (RSI)
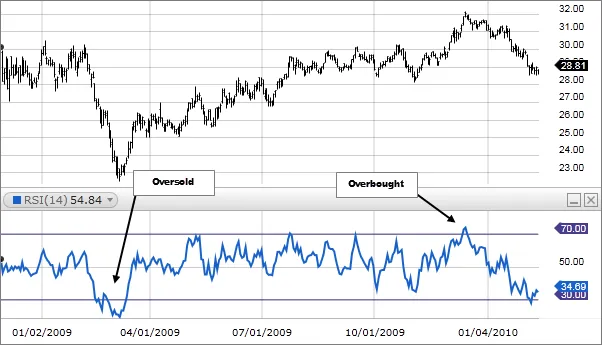
RSI is an indicator that anyone who trades crypto knows well. It shows the strength of current price movements and helps you see when a trend might reverse. The indicator calculates and displays how much an asset has risen and fallen over a specific period.
Traders of all levels, from beginners to advanced, use this indicator a lot. Usually, when the RSI goes above 70 it's considered overbought, and when it drops below 30 it's considered oversold. Based on this, you can gauge when to enter the market and when to get out.
2. Fibonacci Retracements
Fibonacci is used not only in the crypto market but in financial markets in general. It's mainly used to measure support levels. Fibonacci ratios have long been applied to stock prices, a concept that was introduced in the 1930s. It's based on the Fibonacci sequence. This lets you set potential resistance levels and buy and sell strategically. The main resistance [support] levels are generally known to be 38.2%, 50%, and 61.8%.
3. MACD
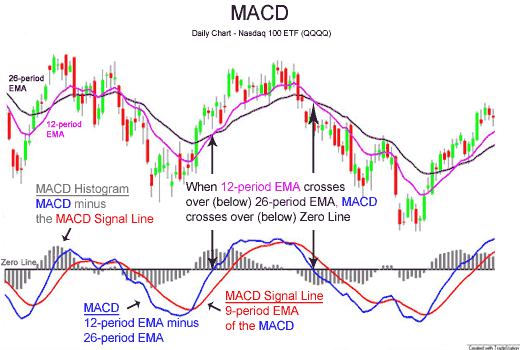
MACD stands for Moving Average Convergence and Divergence Indicator and was developed by Gerald Appel in 1970. MACD shows a histogram for a given market. With it, you can estimate the market's short-term trend as well as whether it's oversold or overbought. Depending on the strength of the signal, you can also anticipate a shift to an uptrend or a downtrend.
4. Bollinger Bands
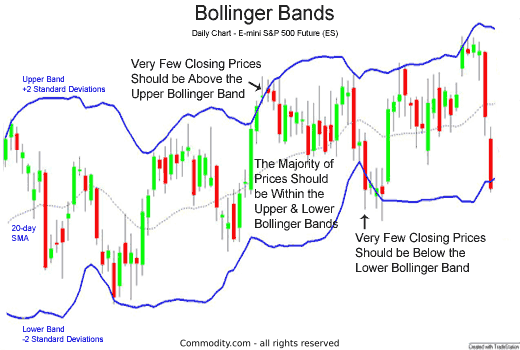
Bollinger Bands are an indicator for looking at price volatility, and they're especially useful in markets with sharp moves, like the crypto market. Bollinger Bands let you look at upward and downward price trends, along with the range of fluctuation and how the price is moving. Using Bollinger Bands together with candlesticks, you can spot signals such as a double bottom and a double top. It's an indicator that most beginners use, and advanced traders use it too.
5. Stochastic Oscillator
The Stochastic Oscillator is an indicator that shows the direction of a trend. Simply put, it lets traders see which direction the current trend is heading. To determine the direction and the price trend, the Stochastic needs about two weeks of data. The Stochastic Oscillator calculates and displays the differences between crypto prices over a specific period. Its value ranges from 0 to 100; generally, a reading above 80 indicates an overbought condition and a reading below 20 indicates an oversold condition. You can think of it as similar to RSI.
6. Average Directional Index
This indicator evaluates price movement qualitatively. The ADI is measured from 0 to 100, and as an indirect signal, it doesn't determine an asset's future price. Instead, it lets you see the strength of an emerging upward or downward trading trend. When the ADI is above 25, you can try a trend-following strategy, and when it's below 25, you can wait. Generally, 0-25 means no trend, 25-50 a weak trend, 50-75 a moderate trend, and 75-100 a strong trend.
7. On-Balance Volume
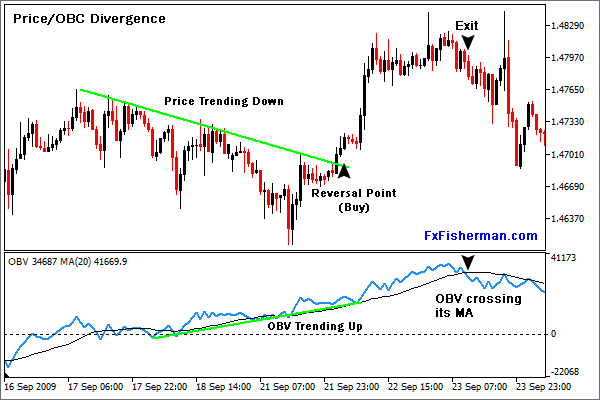
OBV predicts price based on increases and decreases in trading volume. This cumulative indicator calculates total selling and buying volume, and assumes that when a sharp change in volume occurs, it sets the direction of the asset. If volume increases without a change in price, the OBV indicator will rise, pointing to a price increase. If OBV falls while the price stays flat, it means the asset's price is likely to drop soon.
Why does the price drop right after I buy, and go up right after I sell? Have you been trading on gut feeling, without indicators like these? There are many more indicators out there, but I think if you refer to the ones covered in this post, you might get caught in bad positions a little less often. Indicators aren't perfect trading tools, but they can be excellent aids for estimating entry and exit points to some extent. And you can probably guess that when several of these indicators form a particular pattern, that's what we call a 'signal', right?
I hope this was helpful. Happy investing, everyone. Thank you. :)


