How to Read the Bitcoin Rainbow Chart (Pros and Limitations)
3 min read · · Korean original
Contents 4
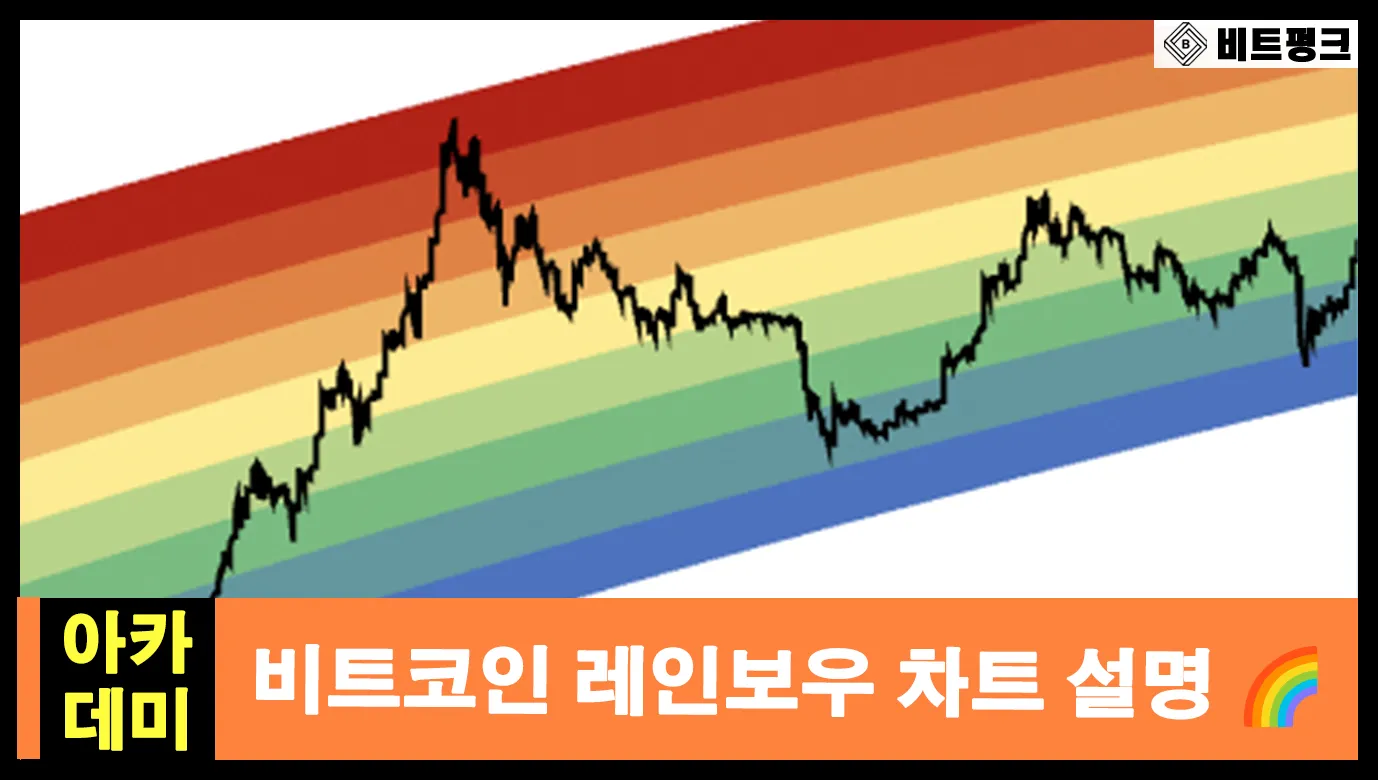
Hello, this is Bitpunk! Today, I'd like to talk about the Bitcoin Rainbow Chart. The Bitcoin Rainbow Chart splits Bitcoin's price movements into bands of rainbow colors. Each color helps you intuitively judge whether Bitcoin is overbought or oversold.
What Is the Bitcoin Rainbow Chart?
The Bitcoin Rainbow Chart is a tool that uses Bitcoin's past price movements to judge whether the current price is undervalued or overvalued. For example, if Bitcoin's price sits in the red band of the Rainbow Chart, the current price is on the high side. On the other hand, if it sits in the blue band, the current price is on the low side.
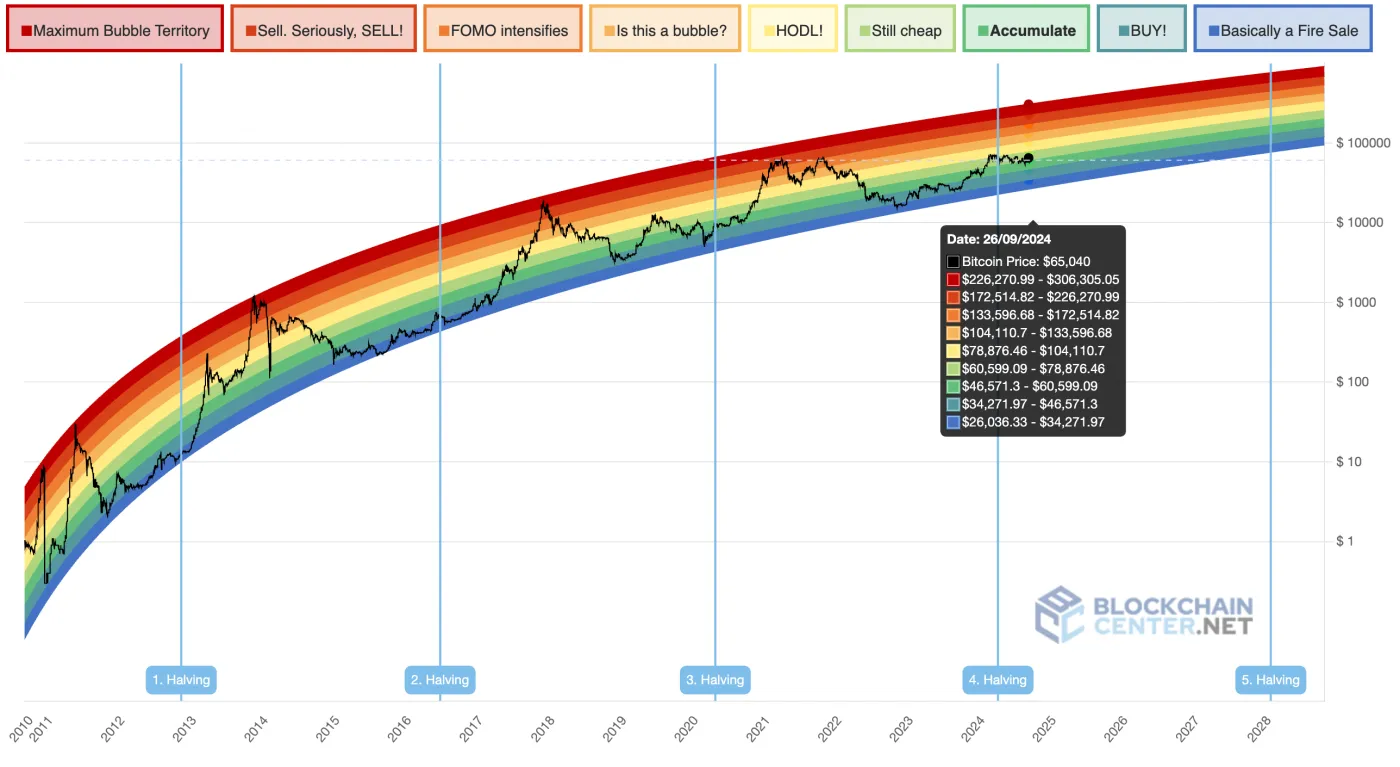
One of the biggest features of the Rainbow Chart is that it uses a logarithmic scale. A log scale lets price changes be drawn as a smooth, continuous line, which makes it much easier to grasp the long-term price trend at a glance.
How Can You Use the Rainbow Chart?
There are three main ways to use the Bitcoin Rainbow Chart. Let's go through them one by one.
1) Identify Bitcoin's Current Price Range
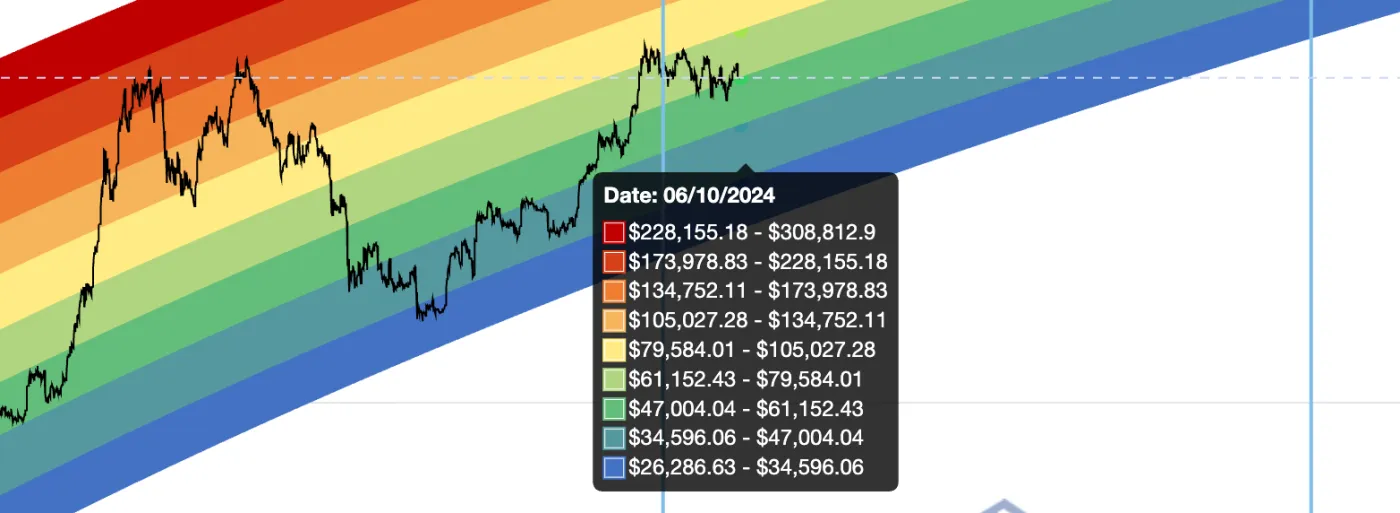
The first thing the Rainbow Chart tells you is which band Bitcoin is in right now. If the price is in one of the lower bands, you might think, 'So Bitcoin is undervalued right now?' On the other hand, if it's close to the red band, you might think, "Hmm, this looks a bit overheated. Should I sell?"
2) Look at Past Patterns
One advantage of the Rainbow Chart is that it makes it easy to see how Bitcoin moved within each color band in the past. For example, if Bitcoin has often risen after staying in the blue band, you could treat that as a bottom and consider it a buying opportunity.
3) Use It Together with Other Indicators
It's a good idea to use the Rainbow Chart together with other technical analysis tools. For example, combining it with indicators such as trading volume, moving averages, MACD, and RSI (Relative Strength Index) can help you find clearer buy and sell timing. Don't forget that it's always important to analyze market trends from multiple angles!
Limitations and Cautions of the Rainbow Chart
The biggest limitation of the Rainbow Chart is that it cannot predict the future with 100% accuracy. The Rainbow Chart has been upgraded from V1 -> V2, and new versions keep being released. In fact, when the price moved far outside the band range, a new color was even added (purple).
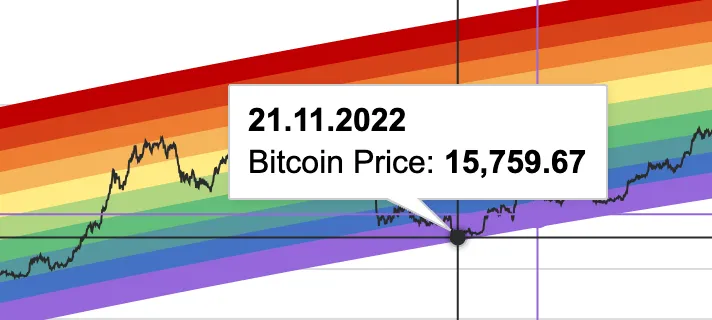
Also, because the Rainbow Chart is based on past price data, it cannot reflect current market trends and price movements. In other words, keep in mind that there are clear limits to perfectly predicting future trends from past data alone.
Finally, you should be aware that the way the Rainbow Chart is drawn and interpreted can be quite subjective. Each color does have its own meaning, but how the bands are painted, interpreted, and applied can differ from person to person, so caution is needed.
Wrapping Up
The Bitcoin Rainbow Chart is a great tool for easily understanding Bitcoin's price movements. Its strength is that you can see at a glance whether the market is overheated or undervalued. However, because it relies on past data, making decisions to buy or sell Bitcoin based on the Rainbow Chart alone is risky.