How to Read Moving Averages and Use Them in Trading (Golden Cross and Death Cross)
4 min read · · Korean original
Contents 8
Moving averages are one of the most widely used indicators in technical analysis. A moving average calculates the average price from past price movements. This helps you identify market trends, and the points where moving average lines (MA lines) cross, known as the golden cross and the death cross, can help you spot shifts into an uptrend or a downtrend.
Technical Analysis and Moving Averages
Traders use a wide variety of technical analysis tools. Technical analysis aims to make informed decisions using historical price data for coins like Bitcoin, Ethereum and BNB. There are hundreds of technical analysis indicators in the trading world, but the most widely used one is the moving average (MA).
What Is a Moving Average?
A moving average is the average of an asset's price over a set period of time. When you connect the moving average values with a line, you get what's commonly called an MA line. MA lines are one of the most popular indicators among traders around the world. Moving averages can be used in many ways, whether you're day trading, swing trading or scalping.
Still not quite sure what a moving average is? The two examples below will help you understand it. Moving averages come in two types: the simple moving average (SMA) and the exponential moving average (EMA). Once you understand the simple moving average, the exponential moving average is easy to grasp too.
Simple Moving Average
A simple moving average calculates an asset's average price using data from a past period. For example, if you set it to calculate the average based on the last 50 days of data, the moving average value is updated based on the most recent 50 days.
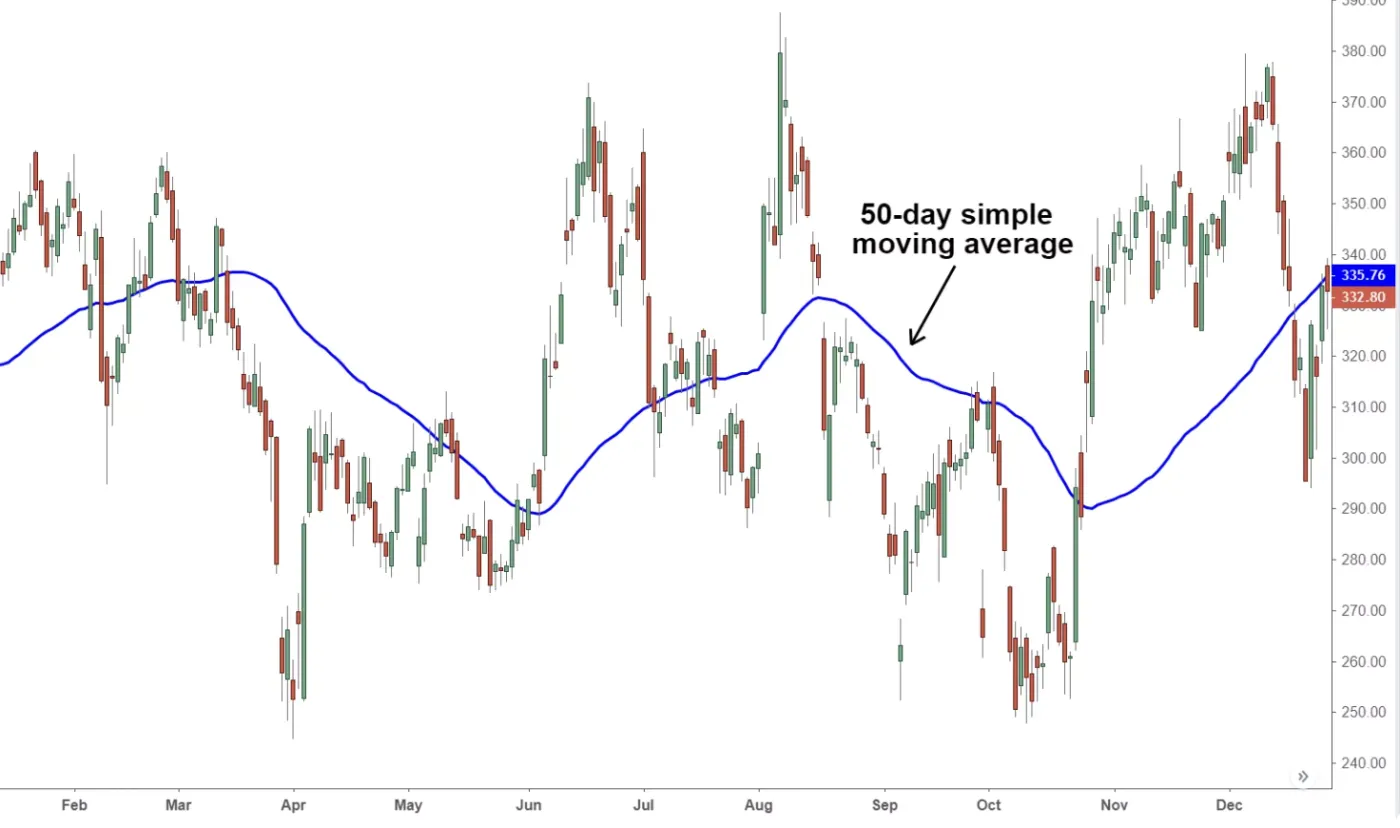
The simple moving average (SMA) treats all data from the last 50 days equally. This means the asset's latest price movements and its older price movements are considered equally important. However, some traders believe that more weight should be given to the latest price movements. That's where the exponential moving average (EMA) comes in.
Exponential Moving Average
The exponential moving average is similar to the simple moving average in that it calculates an average based on an asset's past price movements. The difference is that the exponential moving average gives more weight to the most recent price movements.
The exponential moving average is more useful for sharp price swings and trend reversals. Because it's more likely to anticipate trend reversals faster than the simple moving average, it's often preferred by short-term traders.
How to Trade Using Moving Averages
So how can you actually use moving averages in trading? Moving averages are usually used together with 50, 100 and 200 timeframes. What this means is that, on the 1-day timeframe, you use the 50-day, 100-day and 200-day MA lines together.
With moving averages, the larger the timeframe, the more reliable the signal. That's why many traders consider the 200-day moving average especially important.
Trading with moving averages is simpler than you might think. When the 50-day and 200-day moving averages cross, you can treat it as a signal to buy or sell the asset.
Golden Cross and Death Cross
A rising moving average indicates an uptrend, while a falling MA line indicates a downtrend. However, since it's hard to accurately predict rises and falls with a single moving average alone, it's best to combine several indicators when making a judgment.
A golden cross is when a short-term MA line crosses above a long-term MA line, and it signals the start of an uptrend. Conversely, a death cross is when a short-term MA line crosses below a long-term MA line, and it signals the start of a downtrend.
Using Moving Averages and Things to Watch Out For
So far, we've looked at the concept of MA lines and how to use them in trading based on the 1-day timeframe. However, you don't have to use the 1-day timeframe when analyzing moving averages. Day traders may be far more interested in price movements over the last 1–2 hours. Scalpers, on the other hand, may want to identify trends in price movements over the last 15 or 5 minutes. In these cases, you can switch the moving average timeframe to units like 1 hour, 15 minutes or 5 minutes.
MA lines are useful and convenient tools, but don't forget that they are lagging indicators based on past price movements. In other words, a golden cross may signal an uptrend, but it might appear only after the price has already risen significantly. So if you blindly buy on every golden cross signal, you could end up buying at the top. This kind of false buy signal is called a bull trap.
Wrapping Up
Moving averages are one of the most widely used indicators among traders. They analyze market trends based on historical data and provide clear insight into the market's direction. However, rushing into trading decisions based only on golden crosses and death crosses is risky, so it's important to make your judgment together with other indicators and market conditions.


