
How to Read Bollinger Bands
6 min read · · Korean original
Contents 7
Once you know how to read Bollinger Bands, you can gauge the current state of the market and use them for short-term trading. Bollinger Bands help you anticipate when volatility is about to pick up and identify overbought and oversold conditions.
So what exactly are Bollinger Bands, and how can you use them in trading? Let's walk through the concept and the strategies.
What Are Bollinger Bands?
Bollinger Bands are an indicator developed in the early 1980s by a guy named John Bollinger. John Bollinger was a financial analyst and trader.
The basic idea behind Bollinger Bands is to analyze how prices are distributed around their average.
Bollinger Bands consist of three lines: 1) the upper band, which is the top line, 2) the lower band, which is the bottom line, and 3) the middle band, which is a moving average.
The bands represent the expected range of an asset's price movement. In other words, the upper band is the projected price the asset could rise to, and the lower band is the projected price it could fall to. Since this is displayed visually on the chart, anyone can read it easily.
It may look complicated, but let's take a look at the Bollinger Bands formula first. After all, it's important to properly understand an indicator before you use it. And honestly, the formula isn't that difficult.
The Bollinger Bands Formula
Bollinger Bands set the middle line, the moving average, as a simple moving average. The upper and lower bands are calculated based on market volatility (standard deviation) relative to the simple moving average.
Here is the formula for Bollinger Bands on a 1-day timeframe.
- Middle band: 20-day simple moving average (SMA)
- Upper band: 20-day SMA + (20-day standard deviation *2)
- Lower band: 20-day SMA - (20-day standard deviation *2)
This is the default Bollinger Bands setup, but you can adjust the band values depending on your trading strategy. Now that we've covered the formula, let's look at how to read Bollinger Bands and trade with them.
How to Read Bollinger Bands
Bollinger Bands are a way to analyze market volatility and predict future moves, and they're better suited to short-term trading than long-term investing.
The upper and lower Bollinger Bands widen and narrow in response to market price movements. When price volatility increases, they expand, and when it decreases, they contract.
When volatility rises, the bands expand around the middle band (the moving average), and when volatility is low, they contract around the middle band.
If the price rises above the middle band and breaks through the upper Bollinger Band, the market can be seen as rallying strongly and being overbought. Also, if the price touches the upper band multiple times, this may indicate strong resistance.
Conversely, if the price falls below the middle band and breaks through the lower Bollinger Band, the market can be seen as dropping sharply and being oversold. Also, if the price touches the lower band multiple times, this may indicate strong support.
In addition, if the bands expand excessively, the market may be overheated and could soon enter a sideways phase where the bands contract. On the other hand, if the bands contract excessively, you can expect a market that has been moving sideways to make an explosive move soon.
Trading Strategies Using Bollinger Bands
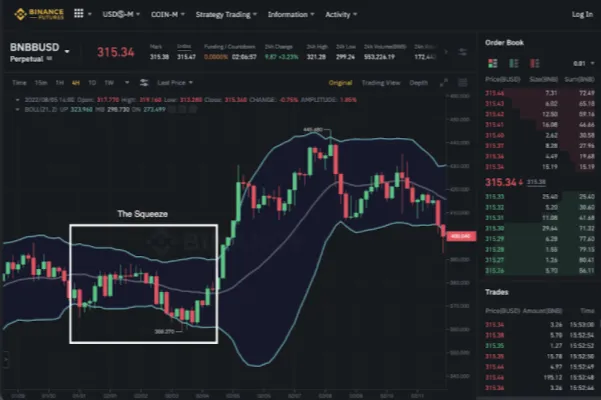
The first strategy is to spot the squeeze. Identifying a squeeze is one of the most important reasons traders use Bollinger Bands.
If the bands are narrowing as in the image below, it means a direction may emerge soon and volatility may increase. However, Bollinger Bands alone can't tell you which direction that will be.
The next strategy is to identify overbought and oversold conditions in the market. RSI is usually the go-to tool for this, but you can also read market conditions with Bollinger Bands. Let's look at the screenshot below together.
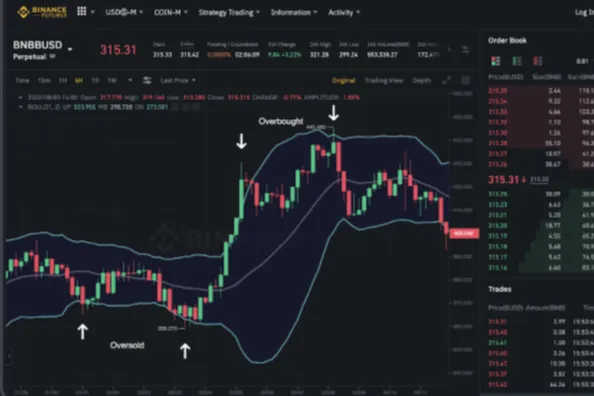
Basically, if the price is moving below the lower band, you can consider it to have entered oversold territory. Conversely, if the price is moving above the upper band, the asset can be considered to have entered overbought territory. These situations can therefore signal a trend reversal, and you can buy or sell the asset at those levels.
However, keep in mind that the price can keep moving in a particular direction regardless of overbought or oversold conditions. That's why, when using Bollinger Bands, it's important to also identify the market trend.
Bollinger Bands vs. Keltner Channels
Finally, let's look at Keltner Channels, which you could call the forerunner of Bollinger Bands. Keltner Channels reflect market conditions faster than Bollinger Bands.
So for judging trend reversals and overbought/oversold conditions, Keltner Channels may be better than Bollinger Bands. On the other hand, Bollinger Bands are slower than Keltner Channels but can convey market conditions more clearly and are less likely to give false signals.
Unlike Bollinger Bands, which are based on a simple moving average and standard deviation, Keltner Channels use ATR (Average True Range) to set the channel around an exponential moving average.
Here is the formula for Keltner Channels on a 1-day timeframe.
- Middle band: 20-day exponential moving average (EMA)
- Upper band: 20-day EMA + (10-day ATR * 2)
- Lower band: 20-day EMA - (10-day ATR * 2)
How to Add Bollinger Bands to Your Chart
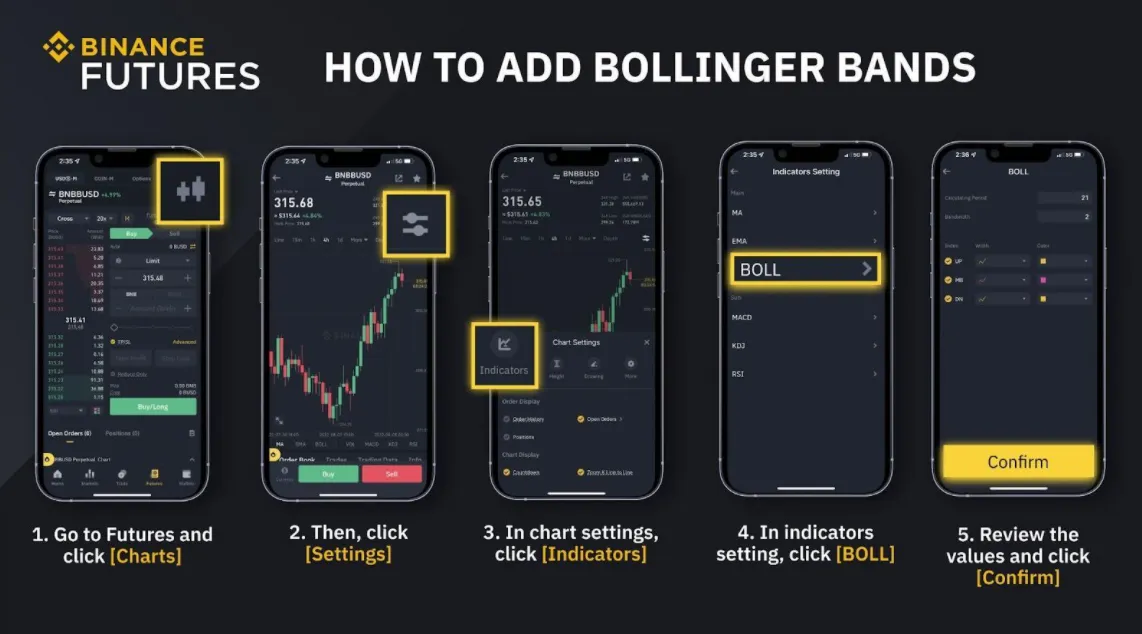
Adding Bollinger Bands to your chart is simple. I'll explain using the Binance exchange as an example. As shown in the image below, go to the chart, find [Settings] - [Indicators] - [BOLL], and click [Confirm].
Don't have a Binance account? If you sign up for Binance through this link, you'll get a 20% fee discount for life.
Wrapping Up
Bollinger Bands are an indicator that lets you identify when a squeeze is happening as well as how oversold or overbought an asset is. Bollinger Bands are a remarkably simple yet useful indicator.
The simplest way to use Bollinger Bands is to buy or sell the asset in the direction the bands expand after narrowing ahead of a squeeze.
Alternatively, you can buy the asset when the price reaches the lower band and sell it when the price reaches the upper band. This strategy is based on the premise that, in practice, more than 80% of an asset's price movement is observed within the bands.
However, as we saw earlier, the price can break out of the bands at any time due to overbought or oversold conditions. So when using Bollinger Bands, it's important to look at the market trend as well, and even if the price has reached the upper band, buying may still be the right call in a bull market.
The Bollinger indicator is remarkably simple yet useful, but trusting it blindly is risky, and you should always have a trading risk management strategy such as a stop loss in place. Also, when volatility shrinks and the bands are narrow, it may not be easy to identify valid trading signals.
In this post, we took a detailed look at what Bollinger Bands mean and how to use them in trading. Thanks for reading.


