What Is a Resistance Level? A Simple Explanation Using Charts
3 min read · · Korean original
Hello, this is Bitpunk. Today we're going to look at resistance levels. A resistance level usually refers to a price zone where the price of a stock, cryptocurrency, or other asset rises but then gets blocked by selling pressure and fails to break through.
If you connect the price highs horizontally on a chart, you can find the price level that the price fails to break through. This is the simplest way to find a resistance level.
- A resistance level is a zone where an asset's price can no longer rise.
- You can roughly find a resistance level by connecting the highs. However, there are other ways to find resistance levels as well.
- Using it together with trendlines can reveal even more interesting points.
What Resistance Levels Tell Us
Resistance levels, along with support levels, are among the most important tools in the technical analysis of stocks, bonds, currencies, cryptocurrencies, and more. Traders can use resistance levels to decide when to sell.
If an asset fails to break through a certain price, it may be time to sell the asset you bought earlier. Of course, this ultimately depends on your own investment goals, and if you're investing with a long-term perspective, you should look at resistance levels on a wider timeframe.
A practical strategy we can take from resistance levels is setting stop-loss orders. With a stop-loss, you can lock in profits on an asset that failed to break through resistance (a stop-profit), or, if the asset failed to break through resistance but is moving sideways without dropping below a certain price, you can consider a strategy of continuing to hold your long position.
How to Use Resistance Levels
Below is a Bitcoin chart from the Binance Futures exchange in May 2020. It's shown on the 1-hour candles. The part I've marked with a dotted line can be considered the approximate resistance level on the 1-hour chart.
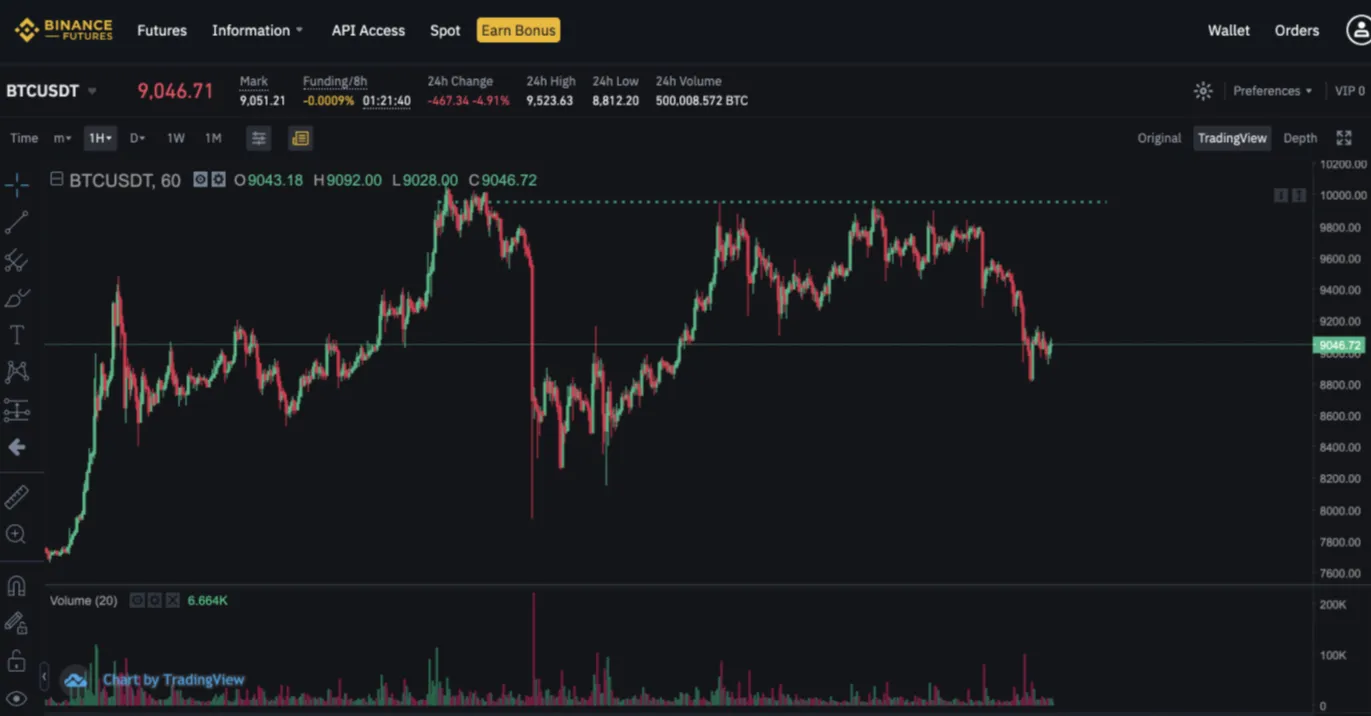
As you can see in the chart above, Bitcoin tried to break through that price level several times around the halving, but ultimately failed, and the price fell. In this way, traders can use resistance levels to look for the right time to sell.
Final Thoughts
Traders can use resistance levels to decide when to sell. However, depending on market conditions, an asset can break through resistance in an instant, and sometimes a resistance level turns into a support level. So when identifying resistance levels, it's best to use as wide a timeframe as possible, and to check whether the level has been tested at least twice before making your call.
That wraps up our look at resistance levels. If you're interested in Bitcoin futures trading, sign up through the links below to get a 10% discount along with a free bonus.
- Sign up for Binance Futures and get a 10% discount: bit.ly/2ZvwdFN
- Sign up for Bybit Futures and get a $50 bonus: bit.ly/2zfLzn0


