12 Chart Patterns Every Trader Should Know
5 min read · · Korean original
Contents 17
- 1. Flag
- Pattern ①. Bull Flag
- Pattern ②. Bear Flag
- Pattern ③. Pennant
- 2. Triangle
- Pattern ④. Ascending Triangle
- Pattern ⑤. Descending Triangle
- Pattern ⑥. Symmetrical Triangle
- 3. Wedge
- Pattern ⑦. Rising Wedge
- Pattern ⑧. Falling Wedge
- 4. Double Top and Double Bottom
- Pattern ⑨. Double Top
- Pattern ⑩. Double Bottom
- Pattern ⑪. Head and Shoulders
- Pattern ⑫. Inverse Head and Shoulders
- Wrapping Up
Do you know the 12 chart patterns every trader should know? In this article, you can learn the basic concepts behind chart patterns such as flags, triangles, wedges, and head and shoulders, and how to use them in your trading.
1. Flag
A flag is a flag-shaped pattern that forms in the opposite direction of the long-term trend. Flags appear after a sharp price move and are mainly used to identify whether a trend is likely to continue.
The key thing to watch in a flag pattern is volume. In an ideal flag pattern, strong volume accompanies the price as it moves up or down, while volume stays low during the sideways phase.
Pattern ①. Bull Flag
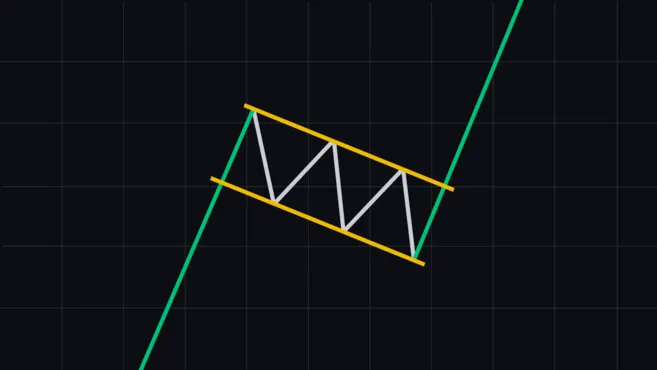
A bull flag is a chart pattern that appears in an uptrend, forming a flag-shaped sideways range after a sharp rise. After that, the rise may continue and set a new, higher high. A bull flag can be read as a temporary downward consolidation within an uptrend.
Pattern ②. Bear Flag
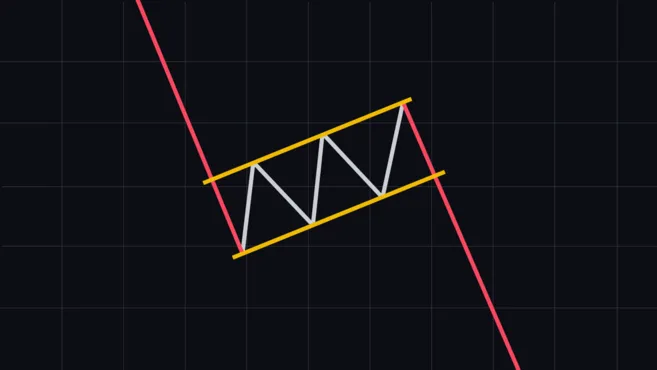
A bear flag is a chart pattern that appears in a downtrend, forming a flag-shaped sideways area after a sharp drop. After that, the decline may continue and set a new low. It can be read as a temporary upward consolidation during a downtrend.
Pattern ③. Pennant
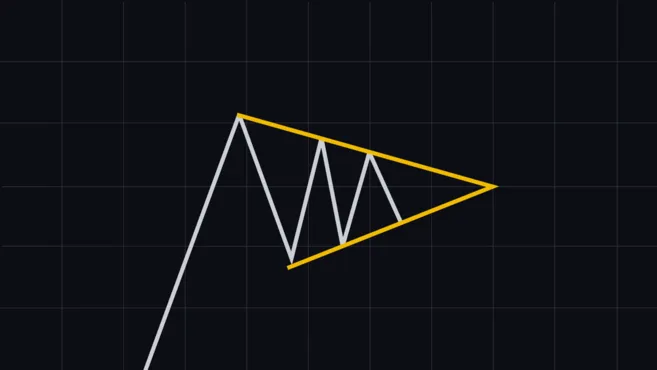
A pennant basically signals consolidation and is similar to a flag. In a pennant pattern, the trendlines converge, and it is generally a neutral pattern. That means its interpretation depends heavily on the context in which it appears.
2. Triangle
A triangle is a chart pattern in which the price converges within an ongoing trend. A triangle means the trend has paused for a while, and it can signal either a trend reversal or a continuation. Triangles are divided into ascending triangles and descending triangles, which appear in uptrends and downtrends respectively.
Pattern ④. Ascending Triangle
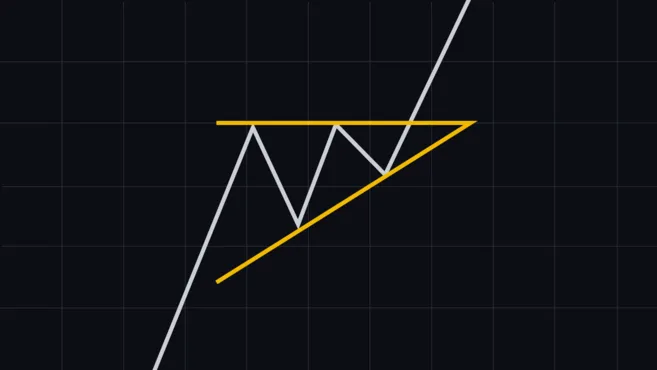
An ascending triangle is made up of a resistance zone and rising lows. Each time the price hits the horizontal resistance and pulls back, more buying pressure comes in and the lows move higher. The price then tends to break through resistance and rise quickly on high volume. The ascending triangle is considered a bullish pattern.
Pattern ⑤. Descending Triangle
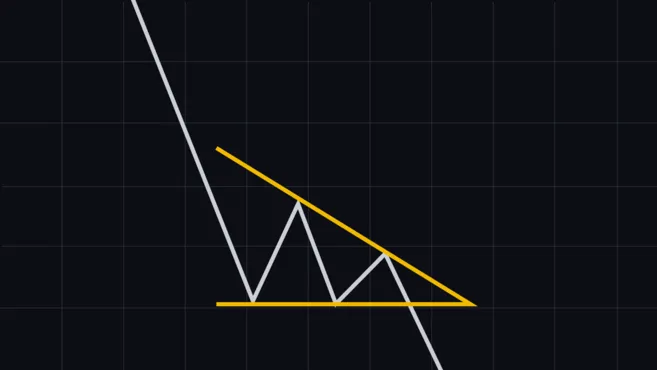
The descending triangle is the opposite of the ascending triangle. A support zone forms while the highs gradually move lower. Each time the price bounces off support, sellers sell the asset at lower prices. When support breaks, the price usually falls quickly on high volume. The descending triangle is considered a bearish pattern.
Pattern ⑥. Symmetrical Triangle
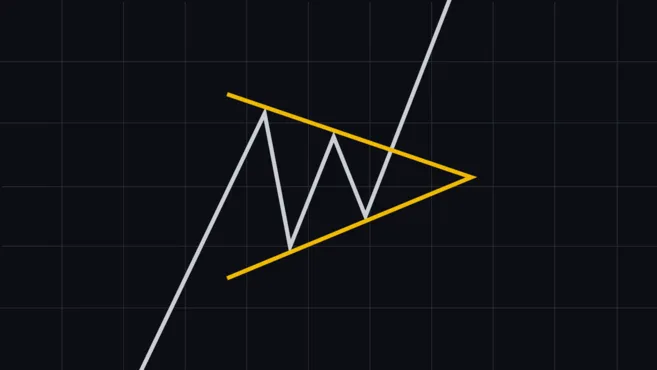
A symmetrical triangle is drawn with a falling upper trendline and a rising lower trendline, both forming at roughly the same slope. Because its interpretation depends heavily on the situation (the underlying trend), the symmetrical triangle is considered a neutral pattern rather than a bullish or bearish one. Sometimes it simply signals consolidation.
3. Wedge
A wedge forms when trendlines converge. This suggests that the underlying trend is weakening and a trend reversal is imminent. If volume decreases within a wedge pattern, it can be read as a sign that the trend is losing momentum.
Pattern ⑦. Rising Wedge
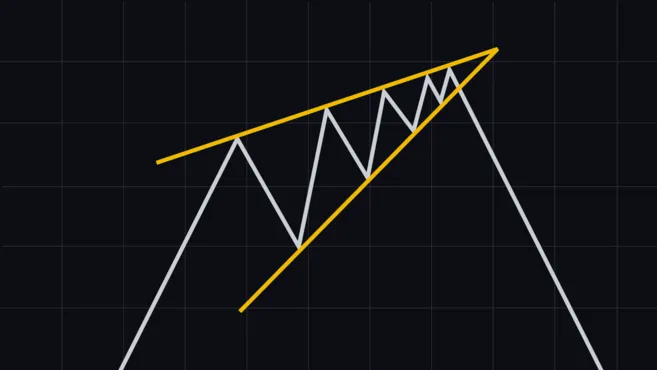
The rising wedge is a bearish reversal pattern in which the price range gradually narrows and the uptrend steadily weakens. Eventually, the lower trendline breaks and a downtrend with falling prices may begin.
Pattern ⑧. Falling Wedge
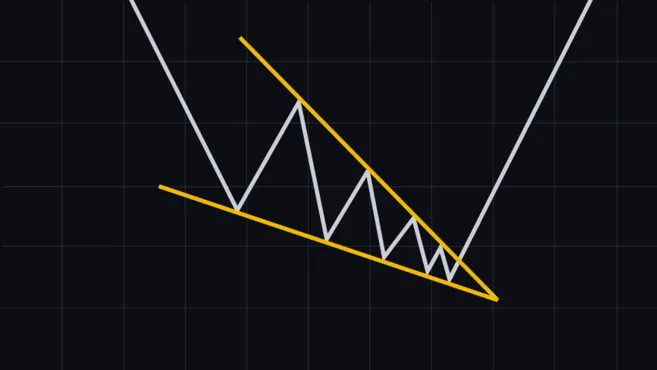
The falling wedge is a bullish reversal pattern in which the trendlines narrow as the price declines. At the end of the convergence, a falling wedge can be accompanied by high volume and lead to a big rise. An upside breakout can be a strong buy signal.
4. Double Top and Double Bottom
Double tops and double bottoms are patterns that occur when the market moves in an "M" or "W" shape. The two lows or highs of these patterns should generally come with higher volume than the rest of the pattern.
Pattern ⑨. Double Top
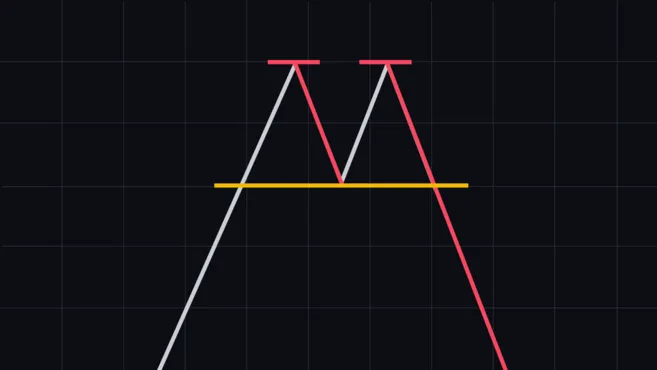
A double top is a bearish reversal pattern in which the price peaks twice and fails to break above on the second attempt. The drop between the two peaks should be moderate, and the pattern is confirmed when the price breaks below the low of the dip between the two peaks.
Pattern ⑩. Double Bottom
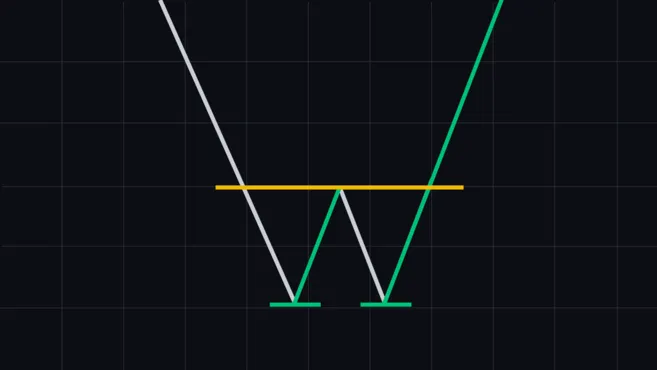
A double bottom is a bullish reversal pattern in which the price hits a low twice and eventually breaks above the high. The bounce between the two lows should be moderate, and the pattern is confirmed when the price reaches a high above the peak of the bounce between the two lows.
Pattern ⑪. Head and Shoulders
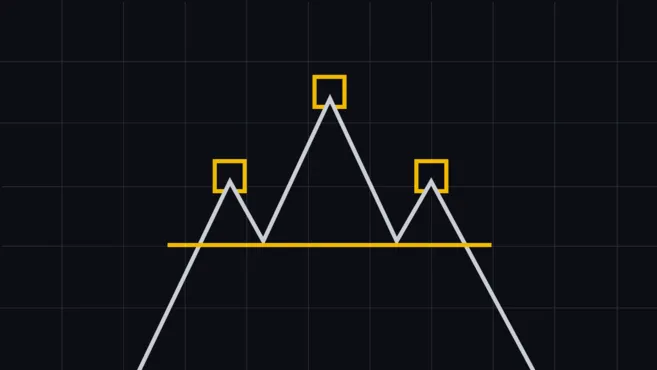
Head and shoulders is a bearish reversal pattern with a baseline (the neckline) and three peaks. The two shoulders should sit at roughly the same price level, and the head in the middle should be higher than both shoulders. The pattern is confirmed when the price breaks below the support line.
Pattern ⑫. Inverse Head and Shoulders
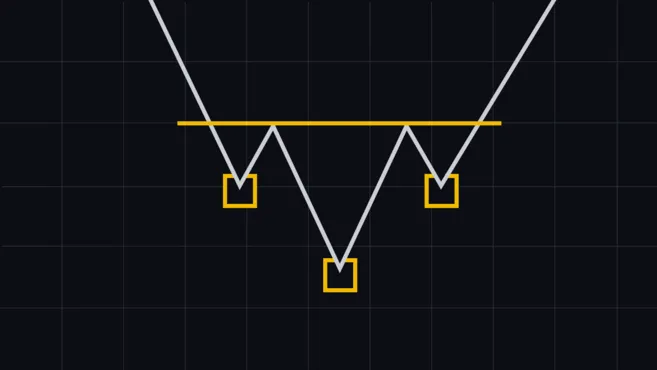
The inverse head and shoulders is also known by the short name "inverse H&S." It is the opposite of the head and shoulders pattern and signals a bullish reversal. In a downtrend, the price sets a new low and then bounces, and an inverse head and shoulders forms when the price bounces again at roughly the same level as the first low. The pattern is confirmed when the price keeps rising through the resistance line.
Wrapping Up
That covers the 12 basic chart patterns. Technical analysis is one of the most effective tools for analyzing the market, but it is important to use it together with other analysis methods. The market is always changing, and the patterns you observe may differ somewhat from how the price actually moves. That is why it is important to protect your capital with proper risk management.


