What Is a Trendline and How Do You Use It
5 min read · · Korean original
Contents 5
A trendline is a technical analysis tool that visually represents the price trend of an asset in financial markets. Trendlines use price data over a specific period and help identify the current market trend.
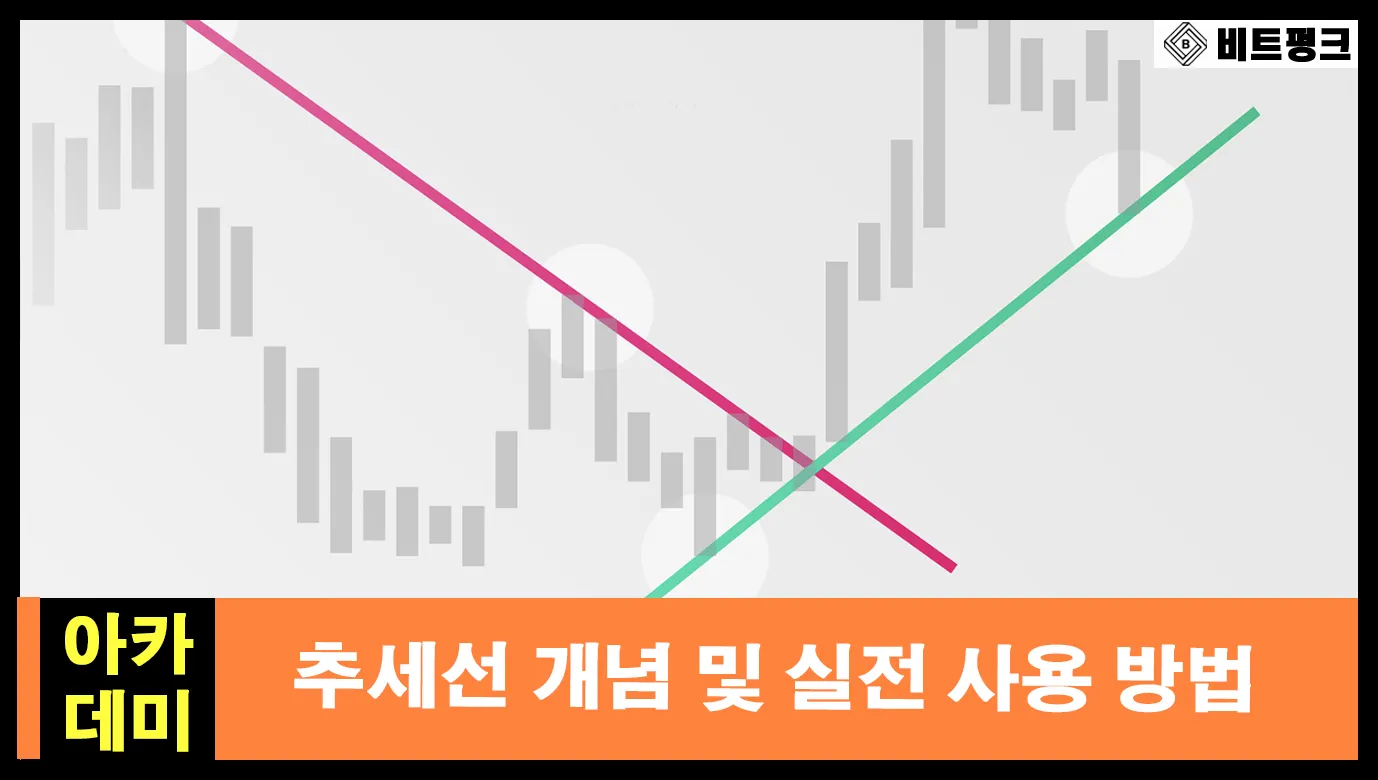
Trendlines are drawn diagonally and are divided into uptrend lines with a positive slope and downtrend lines with a negative slope. The trendline is considered one of the most basic tools in technical analysis and is widely used in all markets, including stocks, derivatives, and crypto assets.
What Is a Trendline?
A trendline mainly plays a role similar to support and resistance lines. However, unlike support and resistance, it is drawn diagonally instead of horizontally and can have either a positive or a negative slope. Generally, the steeper the slope of the line, the stronger the trend.
Trendlines can be divided into upward trends (uptrends) and downward trends (downtrends). An uptrend line is drawn from bottom to top and connects at least two lows. A downtrend line, on the other hand, is drawn from top to bottom and connects at least two highs.
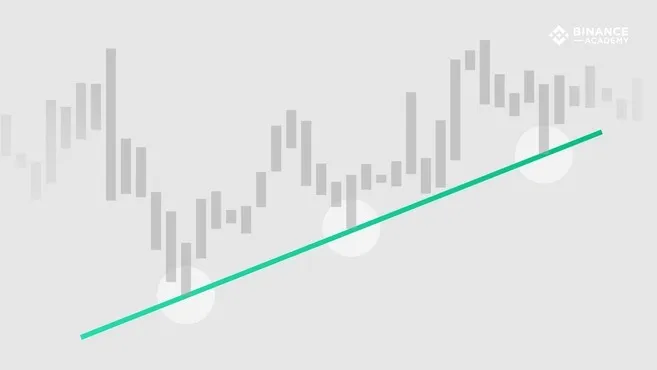
So the difference between the two trendlines lies in which points you choose to draw them. In an uptrend, you draw the trendline using the lowest points on the chart (lows), while a downtrend line is drawn using the highest values (highs).
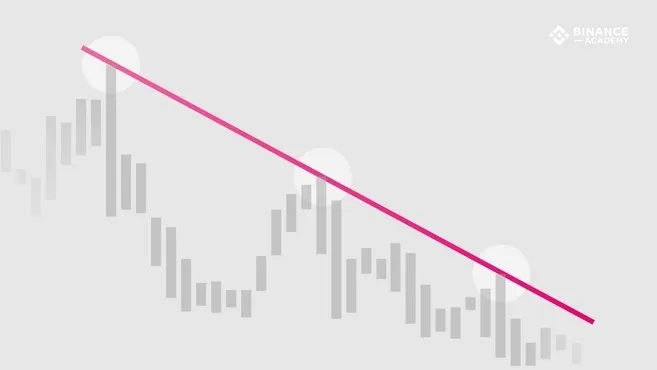
A trendline drawn this way visually shows the market's main trend and helps predict future price movements.
How to Use Trendlines
The way to use a trendline is to consider the trend valid as long as the price lows or highs do not break through the trendline.
In other words, if the lows on an uptrend line do not break below the trendline, you can expect the price to keep rising. On the other hand, if the price breaks through the trendline, the uptrend may be broken and a downtrend may begin.
When analyzing trendlines, you should also take trading volume into account. If the price is rising but volume is decreasing or relatively low, the uptrend line may not be valid.
However, because trendline analysis is subjective by nature, different people may draw trendlines differently. Therefore, for risk management, it is important to combine not only basic fundamental analysis but also several technical analysis techniques.
How to Draw a Trendline
You can draw a trendline by connecting two points on a chart, but most chartists say it is better to use three or more points to draw a valid trendline. The first two points are used to define a potential trend, and the third point is used to test the validity of the trend.
If the price touches the trendline three or more times without breaking through it, the trendline is considered valid. When a trendline is tested multiple times like this, it means the price movement is not random but is actually following a real trend.
However, this method does not apply perfectly in every case, and there may be subjective elements involved. Therefore, it is important to draw trendlines carefully by analyzing market conditions and data comprehensively.
Setting the Trendline Scale
To draw a correct trendline, in addition to choosing three or more sufficient points, setting the right scale is very important. The two most commonly used scales are the arithmetic scale and the semi-logarithmic scale (or semi-log scale).
On an arithmetic chart, changes are displayed uniformly as the price moves up and down the Y-axis. For example, if the price moves from $5 to $10, an arithmetic chart shows the move from $5 to $10 with the same spacing as a change from $120 to $125.
However, a chart using a semi-logarithmic scale (or semi-log scale) displays price changes as percentages. So there is a big difference between a $5 rise from $120 to $125 (a 4.1% rise) and a rise from $5 to $10 (a 100% rise).
It is important to take these scale settings into account when drawing trendlines. Highs and lows can appear differently depending on the chart's scale setting, so the trendline can also vary slightly. Therefore, when drawing a trendline, it is important to carefully check the chart's scale setting and choose an appropriate trendline accordingly.
Final Summary
Trendlines are a useful tool for technical analysis, but they are not perfect and may involve subjective elements.
The choice of points used to draw a trendline can vary somewhat between analysts. Some chart analysts ignore the wicks of candlesticks and draw trendlines based on the candle bodies, while others prefer to draw lines using the highs and lows of the wicks.
For this reason, it is important to use trendlines together with other charting tools and technical indicators. Technical analysis helps you understand the state of the market and identify trends and patterns by combining multiple tools and indicators.
Typical technical indicators used together with trendlines include the Ichimoku Cloud, Bollinger Bands, MACD, Stochastic RSI, RSI, and moving averages. These indicators provide additional information that helps you judge the strength and direction of a trend, as well as overbought/oversold conditions.
That wraps up our look at what trendlines are, how to draw them, and how to use them in trading. Thank you for reading.


