
Elliott Wave Theory: Concept and How to Use It
4 min read · · Korean original
Contents 7
Elliott Wave Theory (EWT) is a theory that assumes the movement of asset prices follows a specific sequence and pattern. According to the Elliott Wave Principle, the market alternates between bearish and bullish phases following a psychological cycle. Using Elliott Waves, you can identify the current market cycle and trend.
However, Elliott Waves are not an indicator or a trading technique but a theory that describes market behavior. For this reason, the wave principle is often used to describe market movements in detail rather than to predict prices.
Ralph Nelson Elliott, the American accountant and author who founded Elliott Wave Theory, said in his book: "The Elliott Wave Principle is not primarily a forecasting tool; it is a detailed description of how markets behave." - Prechter, R. R. Elliott Wave Principle (p.19).
Structure of the Basic Elliott Wave
Elliott Wave Theory is built on a complete 8-wave pattern made up of 5 motive waves (waves moving in the direction of the main trend) and 3 corrective waves (waves moving against the trend).
Elliott Wave Pattern in a Bull Market
A complete Elliott Wave cycle in a bull market is structured as follows.
- Upward wave 1 (motive wave): The main uptrend begins and the price rises.
- Downward wave 2 (corrective wave): After rising, the price temporarily falls.
- Upward wave 3 (motive wave): The uptrend continues and the price rises further.
- Downward wave 4 (corrective wave): The price temporarily falls again.
- Upward wave 5 (motive wave): The final uptrend occurs and the price rises once more.
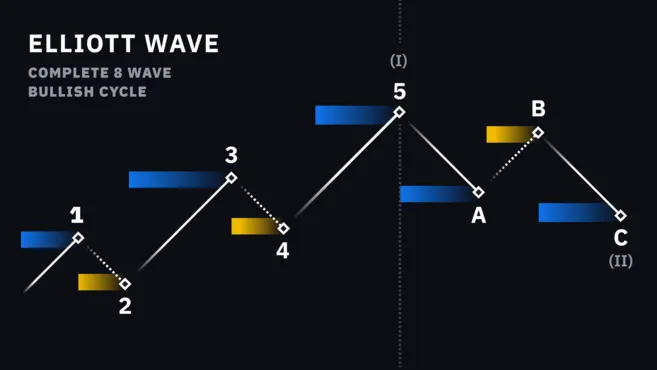
In short, a complete Elliott Wave cycle in a bull market consists of upward waves 1, 3 and 5, while downward waves 2 and 4 are considered corrective waves. After the upward waves are complete, a three-wave A - B - C corrective pattern may also appear.
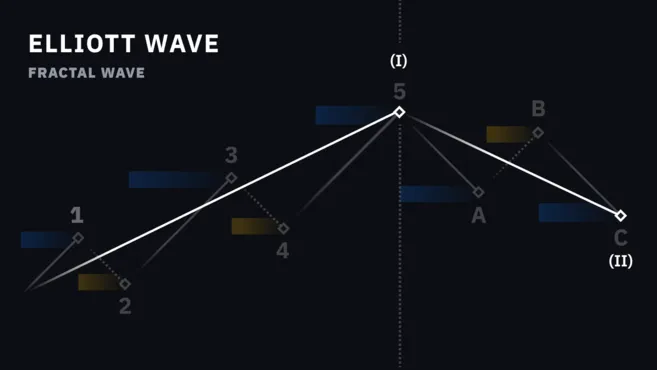
Meanwhile, Elliott Waves are fractal in nature. If you zoom out to a longer timeframe, the entire movement from upward wave 1 to 5 can be regarded as a single motive wave (I). Likewise, downward waves A and B can represent a single corrective wave (II).
Elliott Wave Pattern in a Bear Market
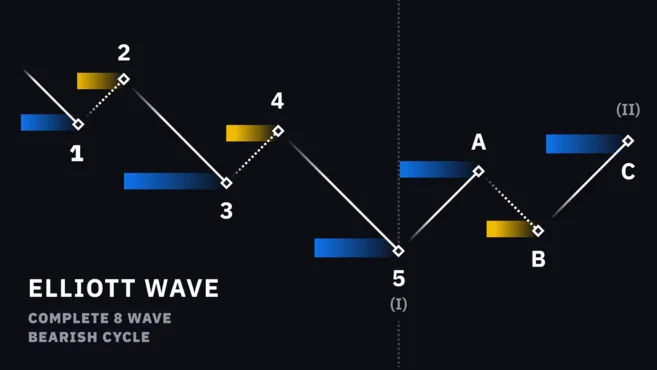
The Elliott Wave cycle in a bear market is structured the opposite way to a bull market. In other words, the price falls in a 1 (down) - 2 (up) - 3 (down) - 4 (up) - 5 (down) wave structure, and may then show an A - B - C shaped rise.
Motive Waves
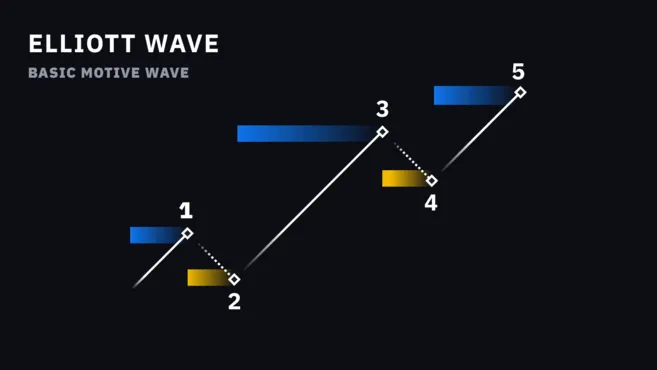
A motive wave is a wave that moves in the same direction as the larger trend. A single Elliott motive wave consists of 5 waves. Elliott set out three rules to describe the motive wave pattern.
- Wave 2 never retraces more than 100% of the preceding wave 1.
- Wave 4 never retraces more than 100% of the preceding wave 3.
- Among waves 1, 3 and 5, wave 3 can never be the shortest, and it usually forms longer than wave 1. Wave 3 also always goes beyond the end of wave 1.
Corrective Waves
Corrective waves have a three-wave structure. They occur between the larger upward and downward waves and are often labeled A, B and C. Unlike motive waves, corrective waves move against the trend, so they tend to be smaller.
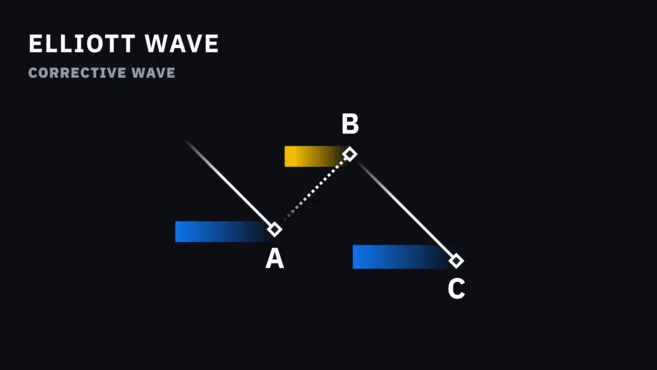
In short, a corrective wave in an uptrend shows the price temporarily falling and then rising again, while a corrective wave in a downtrend shows the price temporarily rising and then falling again.
Corrective waves can sometimes be hard to identify because of their counter-trend movement. So to pinpoint corrective wave patterns accurately, it's a good idea to use other technical analysis tools alongside them.
Prechter emphasizes that the most important rule to keep in mind about corrective waves is that they are never made up of a five-wave structure.
Are Elliott Waves Accurate?
There is plenty of debate about how effective Elliott Wave Theory is. The theory involves a lot of subjectivity, and different traders can interpret it differently.
That said, many traders apply Elliott Wave Theory successfully and make a profit. To overcome the subjectivity and apply the theory more objectively in their trading strategies, they often combine it with technical indicators such as Fibonacci retracement.
Final Summary
Elliott Waves are a theory rather than a technical analysis indicator, so there is no exact method of use or definitive set of rules. To predict market movements with Elliott Waves, you need to learn and understand how to count the waves. This takes training and experience, and it can be risky for beginners.
When using Elliott Waves, it's best to combine them with other technical analysis tools to minimize subjectivity and find clear signals. It's also a good idea to take a comprehensive approach that considers other aspects of the market, so you can assess market trends and build an effective trading strategy.
That wraps up our look at Elliott Waves. If you found this post helpful, please tap the heart below and share it widely. Thank you!


