Fibonacci Retracement Fully Explained
5 min read · · Korean original
Contents 8
Fibonacci retracement is based on the Fibonacci sequence and is used to find important price levels on a chart. Traders can use Fibonacci retracement levels and ratios to identify support and resistance and to set their take-profit and stop-loss points.
What Is Fibonacci?
The Fibonacci sequence is a number sequence discovered about 700 years ago by the Italian mathematician Fibonacci. It is observed in many natural phenomena and, surprisingly, is also used in financial markets.
Fibonacci is calculated as follows. First, there are two numbers, 0 and 1. The next number is made by adding the two numbers before it. If you keep doing this forever, you get a series of numbers called the Fibonacci sequence.
0, 1, 1, 2, 3, 5, 8, 13, 21, 34, 55, 89, 144, 233, 377, 610, 987...All of the levels used in Fibonacci retracement are derived from these numbers.
What Is Fibonacci Retracement?
Fibonacci retracement converts Fibonacci ratios into percentages, and traders use it to understand where an asset's price currently stands and how far it has retraced.
The core idea of Fibonacci retracement is that when a price rises or falls, its upward or downward movement may follow the Fibonacci retracement ratios shown below.
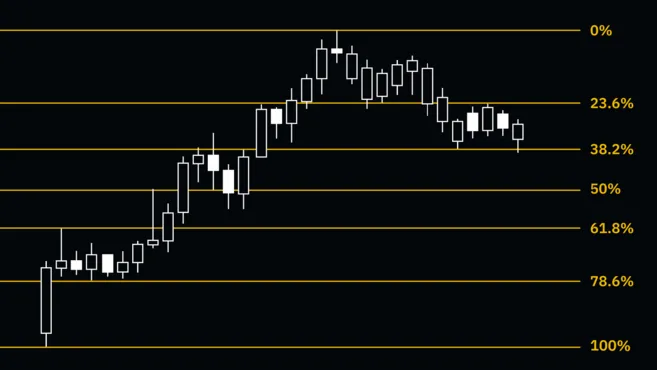
The main Fibonacci ratios are 0%, 23.6%, 38.2%, 61.8%, 78.6%, and 100%, and these points are considered important price zones.
How to Calculate Fibonacci Retracement
To calculate the first ratio, 23.6%, you can divide a given Fibonacci number by the number two places to its right. For example, dividing 21 by 89 gives 0.2365. This is rounded and shown as 0.236, or 23.6%.
You can calculate the second ratio in the same way. Dividing 21 by 55 gives 0.3818. This is rounded and shown as 0.382, or 38.2%. The 61.8%, 78.6%, and 100% ratios are calculated the same way.
In addition, traders consider 50% somewhat meaningful because it marks the midpoint of a price range, and they can also use Fibonacci extension ratios that fall outside the 0–100% range (for example, 161.8%, 261.8%, or 423.6%).
How to Use Fibonacci Retracement
The Fibonacci retracement tool is used by drawing it on a chart as levels between a high and a low. Generally, in an uptrend, the low becomes 1 (or 100%) and the high becomes 0 (or 0%).
When you draw Fibonacci levels with the Fibonacci retracement tool, you can identify potential support zones that the market may test if it starts to retrace.
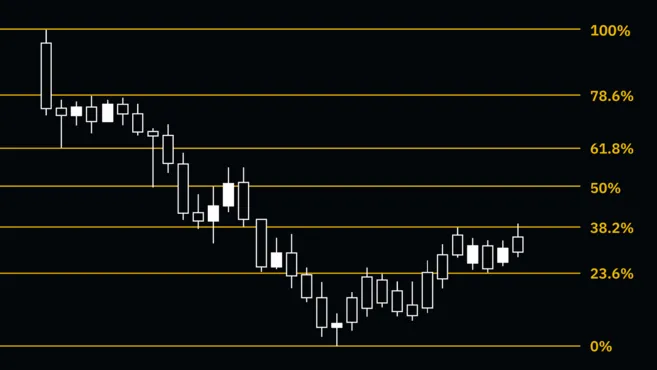
Conversely, in a downtrend, the low becomes 0 (or 0%) and the high becomes 1 (or 100%). In this case, the Fibonacci retracement tool lets you anticipate potential resistance levels when the market starts to rise.
In short, the Fibonacci retracement tool is useful for identifying potential support levels in an uptrend and potential resistance levels in a downtrend.
Trading Strategies Using Fibonacci Levels
By drawing the levels marked by Fibonacci ratios on a chart, traders can build strategies around support, resistance, retracement zones, entry points, exit targets, and stop-loss levels.
For example, if the price shows a temporary dip in an uptrend and is likely to find support at the 61.8% Fibonacci level and rise again, you could consider opening a buy position at that point. Also, if the 100% Fibonacci level acts as strong resistance in an uptrend, you could consider a sell position at that point.
Fibonacci levels are often used together with Elliott Wave Theory to understand the relationship between wave structure and zones of interest. This can be a powerful strategy for predicting the degree of retracement in various waves.
Also, Fibonacci levels are most effective when combined with other technical analysis indicators. Fibonacci levels on their own may not be buy or sell signals, but when combined with other indicators, they can be used as buy or sell signals.
The Fibonacci Sequence and the Golden Ratio
The golden ratio (0.618 or 1.618), derived from the Fibonacci sequence, shows remarkable consistency in nature and art. The golden ratio is observed in a wide range of things and phenomena, such as atoms, stars, galaxies, seashells, and honeybees.
For centuries, artists, engineers, and designers have used the golden ratio to create aesthetically pleasing compositions. Many famous works and designs, such as the pyramids, the Mona Lisa, and the Twitter logo, have used the golden ratio in pursuit of optimal beauty.
Surprisingly, the golden ratio also plays an important role in financial markets. Applying the golden ratio to a chart with the Fibonacci retracement tool helps identify important support and resistance levels in price movements.
Fibonacci Extensions and How to Use Them
Fibonacci extensions extend the standard Fibonacci levels and use ratios such as 138.6%, 150%, and 161.8%. Going further, you can also use higher ratios such as 261.8% and 423.6%.
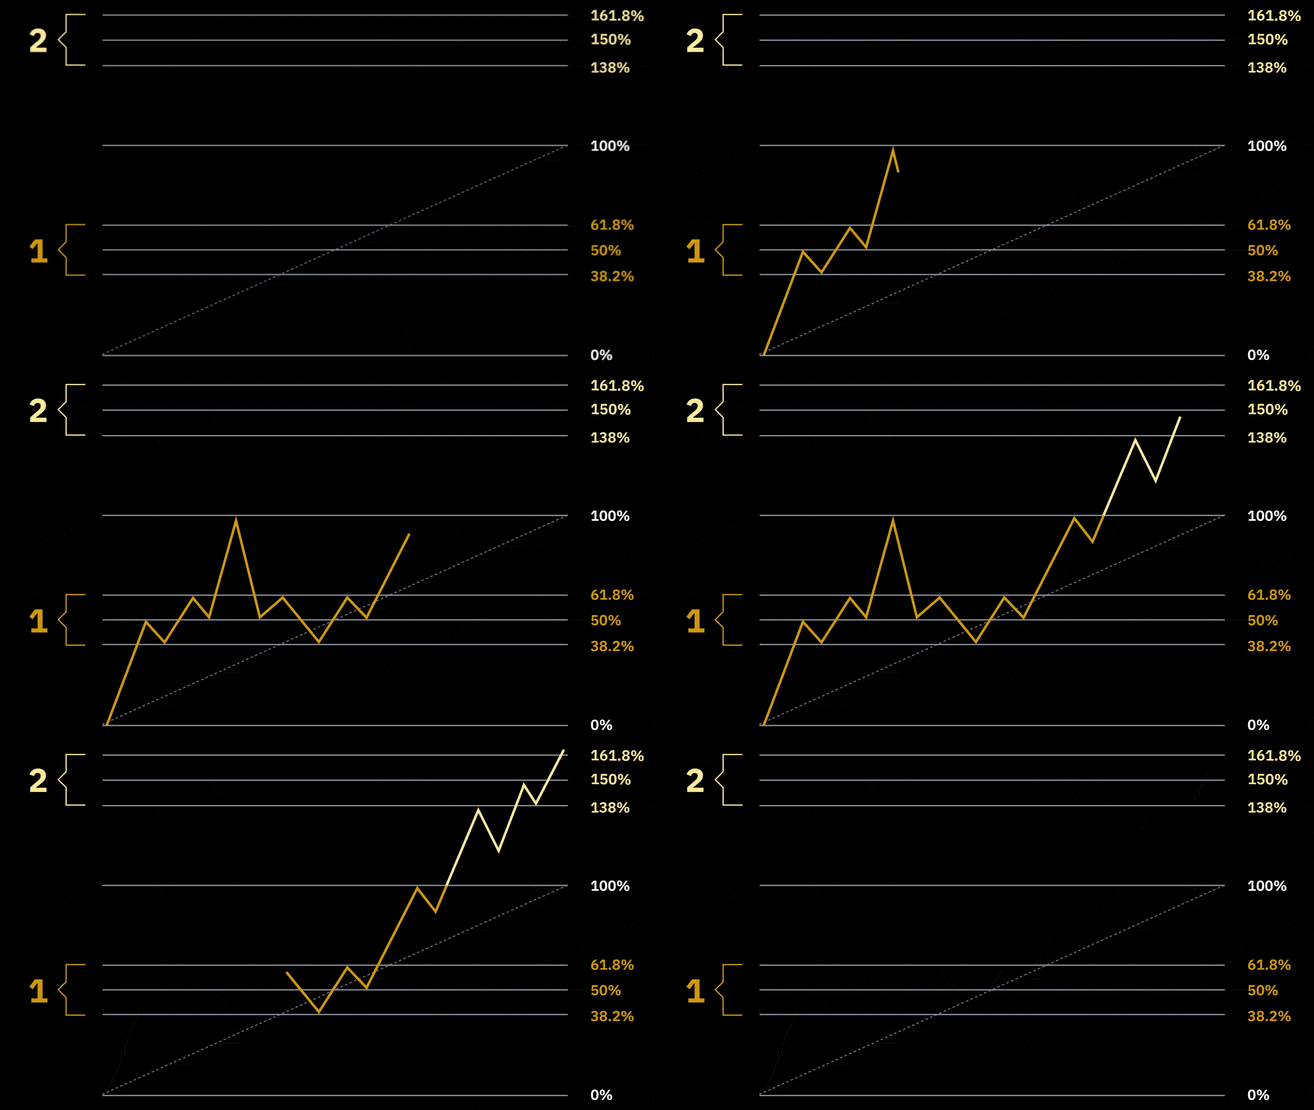
For example, suppose that in an uptrend the rising price has reached $100. If you apply Fibonacci extension levels and the 161.8% extension level is $261.8, traders can read this as the price potentially setting new highs up to that point. In other words, it means the uptrend could extend and the price could rise to that level.
Final Thoughts
Many traders believe they can analyze the market by applying Fibonacci numbers to chart analysis in financial markets and using Fibonacci levels.
However, Fibonacci levels have a subjective side. They are not based on scientific principles or laws of physics, and they do not clearly explain the relationship between price movements, chart patterns, and indicators. So relying on Fibonacci levels alone can be risky.
Even so, because many market participants pay attention to Fibonacci levels and tend to use them, Fibonacci levels can be useful.
Using Fibonacci levels together with candlesticks and other technical indicators can develop them into stronger trading signals. That wraps up our look at the concepts of Fibonacci and Fibonacci retracement and how to use them. Thank you.


