What Are Candlestick Patterns and How Can You Use Them?
9 min read · · Korean original
Contents 6
What are candlesticks, and how can you use them in your trading? Reading candlestick patterns well can help you spot potential trend reversals or confirm an existing trend.
In this post, we'll take a close look at what candlesticks are and how to use them. Does it look difficult and complicated? Don't worry. We'll explain it as simply as we can.
What Is a Candlestick?
A candlestick is a "trading tool" that shows an asset's price movement in the shape of a candle. Candlesticks were first developed in 18th-century Japan and have been used by many traders over the past few centuries.
Candlesticks can be used to analyze past price data and predict future price movements. In other words, if you use candlesticks well, you can analyze and predict market movements in your current timeframe.
How is that possible, you ask? Individual candles form what are called "candle patterns," which indicate whether the price is likely to rise, fall, or stay flat. By looking at these patterns, we can get a read on how the market is moving.
How Is a Candlestick Made Up?
Before you can understand candle patterns, the very first thing you need to know is how a basic candlestick is constructed. A candlestick is generally made up of four elements: 1) the open, 2) the high, 3) the low, and 4) the close.
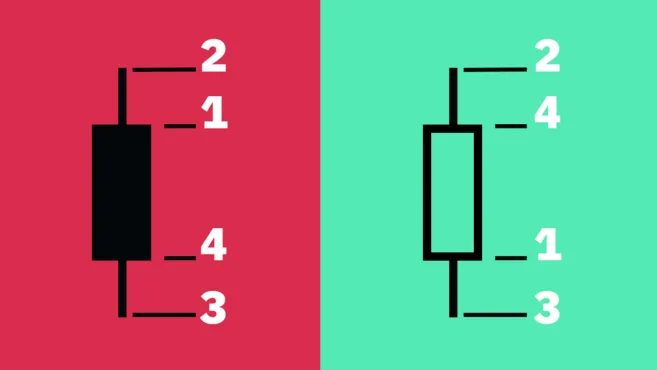
- Open: The first traded price of the asset during a given period.
- High: The highest traded price of the asset during a given period.
- Low: The lowest traded price of the asset during a given period.
- Close: The last traded price of the asset during a given period.
On a candlestick, the distance between the open and the close is called the body, and the distance between the body and the high or low is called the wick (or shadow). Is it starting to make sense?
The distance between a candle's high and low is called the candle's range. A green body indicates that the price rose during that period. A red body, on the other hand, represents a bearish candlestick and indicates that the price fell during that period.
A bit complicated? That's okay. It may not click right away, but if you keep looking at it again and again, the time will come when it all makes sense.
Now that you understand the basic candlestick, shall we look at some commonly used patterns and how to use them in your trading?
What Are Candlestick Patterns?
Candlestick patterns are formed when multiple candles line up in a particular order. Each candlestick pattern has a different meaning. Some candle patterns show a strong imbalance of power between buyers and sellers, while others can signal a reversal, a continuation, or sideways movement.
Below is a cheat sheet of candlestick patterns. For example, what if three green bullish candles appear in a row? Traders may read this as a "strong buy signal." In other words, a "bullish candle pattern" has formed.
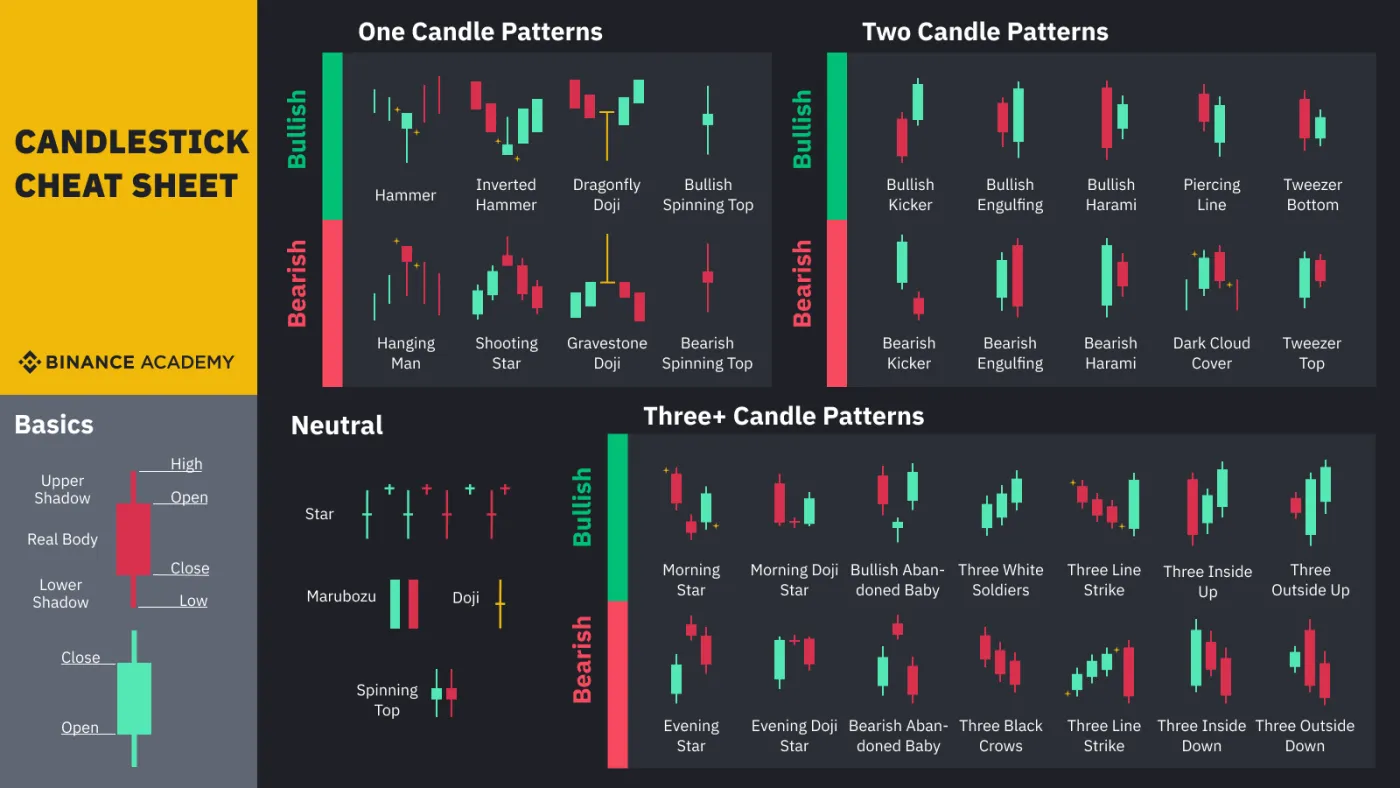
You can use these candlestick patterns together with moving averages, RSI, MACD, Bollinger Bands, and more. We've also put together articles on these indicators, so feel free to check them out.
🪽 4 Recommended Technical Indicators
What Are the Most Commonly Used Candlesticks and Patterns?
Now that you understand the concept of candlesticks and their patterns, let's look at the most commonly used candlesticks and patterns. Candlestick patterns fall broadly into "bullish candle patterns" and "bearish candle patterns," and within each group there are many different candle signals.
Keep in mind that candlestick patterns are not inherently buy or sell signals. They are one way of looking at the current market trend and spotting opportunities. That's why it's always best to look at patterns in context. When using candlesticks in their trading, traders should also consider other factors such as trading volume, market conditions, and the overall direction of the trend.
1. Hammer
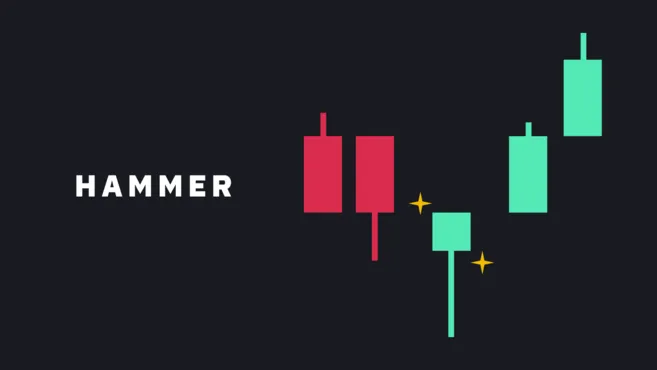
A hammer appears at the end of a downtrend. It's a candlestick with a long lower wick, typically at least twice the size of the body. A hammer means that despite heavy selling pressure, the price bounced back up. You can look for a potential price rise ahead.
2. Inverted Hammer
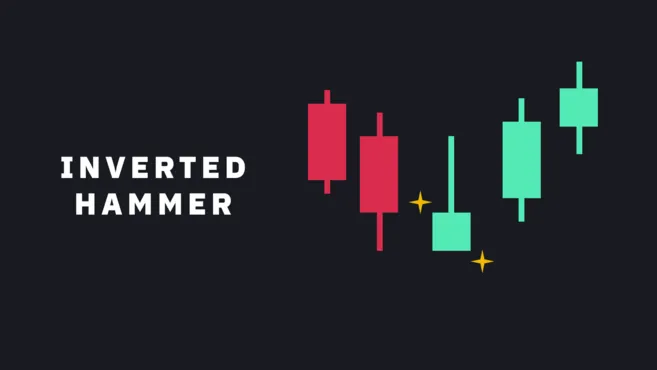
The inverted hammer pattern has a long wick above the body rather than below it. As with the hammer, the upper wick should be at least twice the size of the body. The inverted hammer appears at the end of a downtrend and can signal a potential move up.
For example, the upper wick means that even though sellers tried to push the price down, the price did not fall. So the inverted hammer can mean that buyers may soon take control of the market.
3. Three White Soldiers
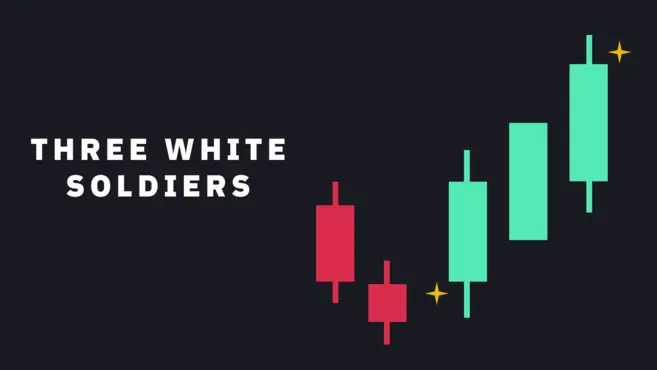
The three white soldiers pattern consists of three consecutive green candles, where each candle opens within the body of the previous candle and closes above the previous candle's high. These candlesticks should not have long lower wicks, and they indicate that steady buying pressure is coming in and pushing the price higher.
4. Bullish Harami
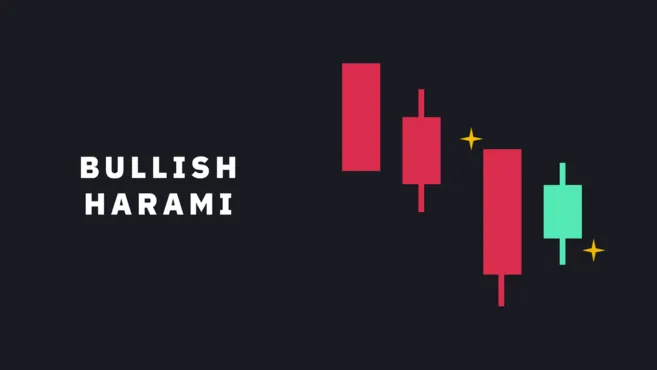
A bullish harami is a pattern where a long bearish candle is followed by a small green candle that sits entirely within the previous candle's body. A bullish harami can form over two or three periods or more, and it's a pattern that hints at a reversal, indicating that selling momentum is slowing and may soon come to an end.
5. Hanging Man
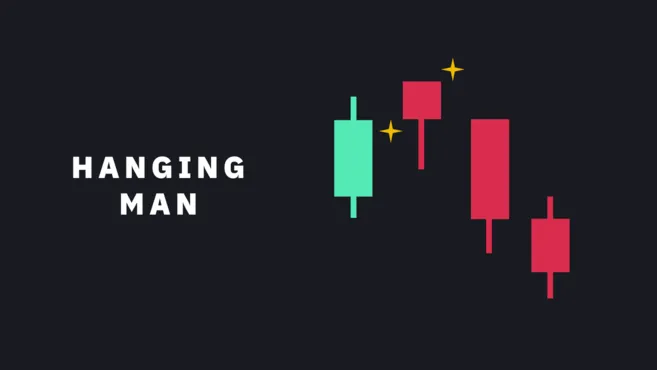
The hanging man is the bearish counterpart of the hammer. It typically has a small body and a long lower wick, but unlike the hammer, it forms at the end of an uptrend.
The lower wick shows that there was heavy selling, but buyers managed to push the price back up anyway. With this in mind, it can be read as a warning that, after a long uptrend, the rally may soon lose momentum.
6. Shooting Star
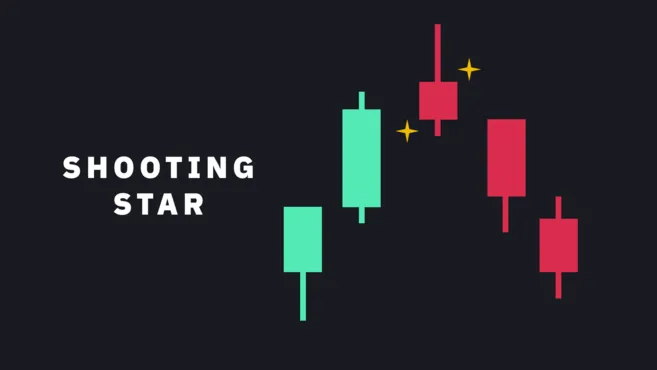
A shooting star is a candlestick with a long upper wick, little or no lower wick, and a small body near the bottom. The shooting star looks similar to the inverted hammer, but it forms at the end of an uptrend. It indicates that the market reached a high, but sellers took control and pushed the price back down. Some traders prefer to wait for the next few candlesticks to form after a shooting star to confirm the pattern.
7. Three Black Crows
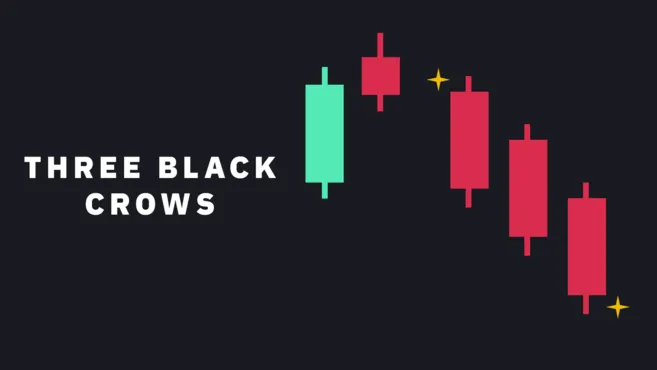
Three black crows consists of three consecutive red candles, where each new candle opens within the body of the previous candle and makes another low below the previous candle's low.
8 Bearish Harami
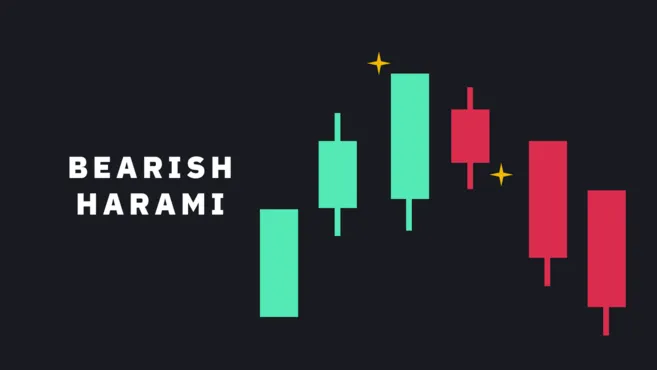
A bearish harami is a pattern where a long green candle is followed by a small red candle that sits entirely within the previous candle's body. A bearish harami can last two periods or more and appears at the end of an uptrend.
9. Dark Cloud Cover
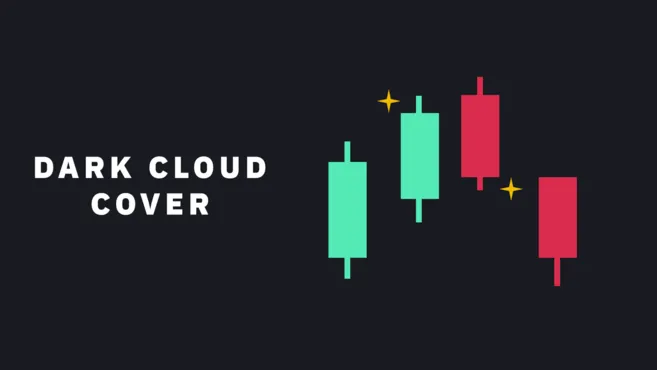
The dark cloud cover pattern consists of a red candle that rises above the previous green candle's close and then closes below that candle's midpoint.
This pattern can often be accompanied by high trading volume, and it means that momentum may be shifting from bullish to bearish. Traders may wait for a third candle to appear to confirm the pattern.
10. Bullish Candle Pattern
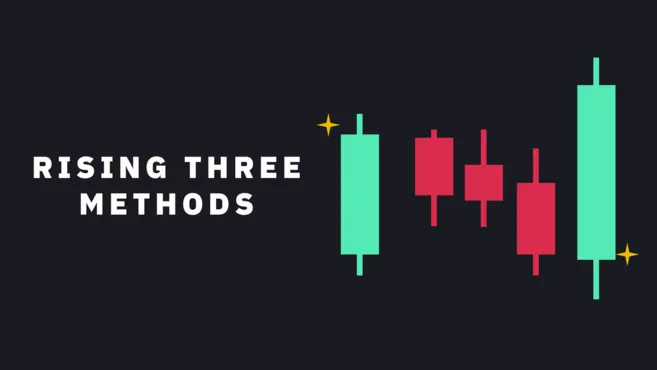
This bullish candle pattern refers to three consecutive small-bodied red candles followed by a large green candle. Ideally, the red candles should not move outside the range of the candle before them.
11. Bearish Candle Pattern
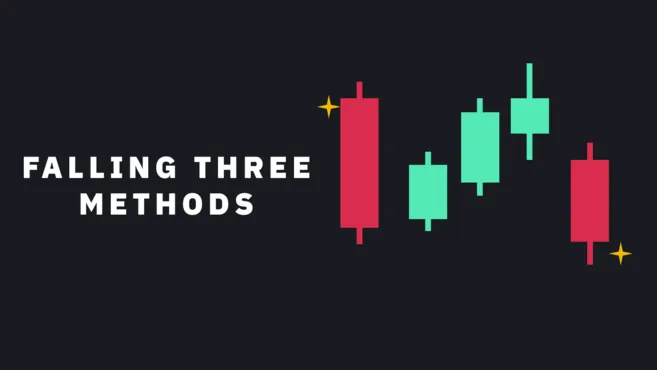
Unlike the bullish candle pattern, this bearish candle pattern refers to a long red candle followed by small green candles. After that, another large red candle appears and breaks out of the range.
12. Doji Candles
A doji forms in the shape of a cross when the open and close are the same or very close to each other. The price may move up and down around the open, but it ultimately closes at or near the open. A doji can therefore represent a standoff between buyers and sellers. However, how a doji is interpreted depends on the context.
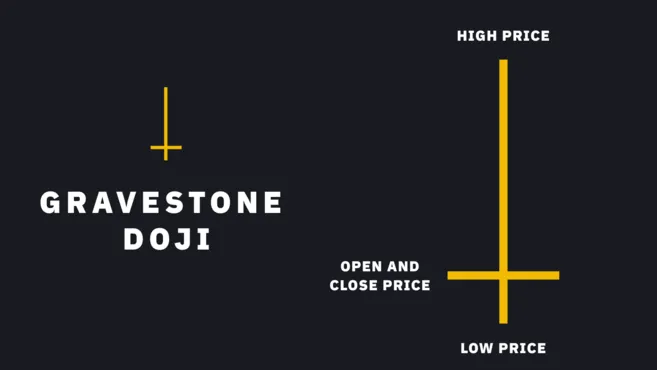
The "gravestone doji" shown above, with a long upper wick and the open and close near the low, is a bearish reversal candle. In other words, it means sellers were stronger than buyers and pushed the price down significantly.
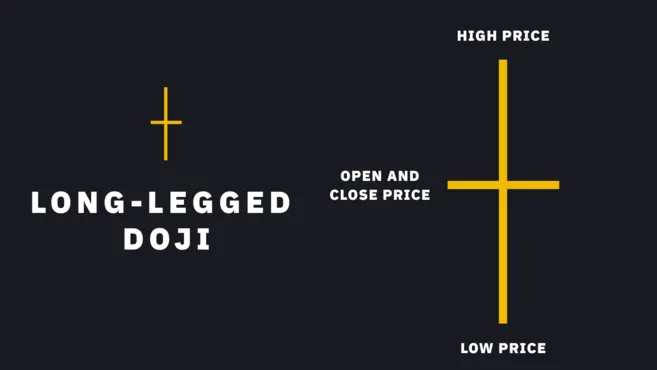
The "cross doji" shown above is a neutral candle with long upper and lower wicks and the open and close near the midpoint. In other words, it means buying and selling pressure were roughly equal.
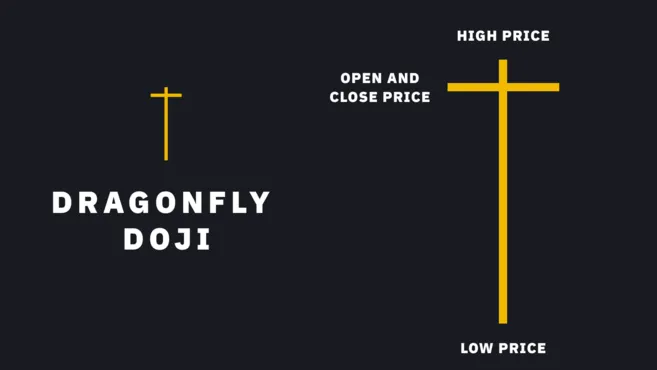
The "dragonfly doji" has a long lower wick, with the open/close located near the high. In other words, it means buyers were stronger than sellers and pushed the price upward.
How Do You Use Candlesticks and Patterns in Trading?
So how can you put candlesticks and their patterns to use in trading? Here are four tips for making good use of candlesticks in real-world trading.
1. Understand the Basics and Get Hands-On Experience
Before making trading decisions based on candlestick patterns, traders need to understand the concept of candlestick patterns accurately. You should know what each candlestick means and be familiar with the various patterns, and it's a good idea to get some hands-on experience with them.
2. Combine Them with Other Indicators
Candle patterns can provide good insights, but they work even better when used together with other indicators. Examples of indicators you can use alongside candle patterns include moving averages, RSI, and MACD.
3. Use Multiple Timeframes
To get a broader understanding of market sentiment, it's a good idea to analyze candle patterns not only on the 5-minute and 15-minute timeframes but also on the 1-hour, 4-hour, and 1-day timeframes. For example, a trader analyzing the daily chart for day trading would do well to also look at the hourly and 15-minute charts.
4. Have a Risk Management Strategy
Candle patterns are a great trading tool, but "relying on them alone with full confidence is risky." Every trade comes with risk, so it's always wise to manage your risk well, for example by setting a stop loss. It's also a good idea to avoid overtrading and to build the habit of entering only at favorable setups where you've calculated the risk-reward ratio in advance.
Wrapping Up
Candlestick charts are one of the most fundamental tools traders and investors around the world use to analyze the market. Candlesticks let you grasp price movement at a glance, and the shape and patterns of each candle help you identify trends and volatility.
However, please don't forget that while candlesticks can be useful for market analysis, they are not perfect. Indicators are ultimately just useful tools that help you understand the buying and selling forces that move the market, not the answer.


