
How to Read the MACD Indicator (Concept and Trading Uses)
5 min read · · Korean original
MACD stands for Moving Average Convergence Divergence. It is an oscillator-type indicator widely used as a trend-following tool to gauge an asset's momentum. MACD is based on moving averages and is calculated using simple moving averages and exponential moving averages. For reference, moving averages are among the most widely used indicators in technical analysis.
What Is MACD?
In Korean, MACD is called 이동평균 수렴 확산 (moving average convergence divergence). As the indicator's name suggests, MACD tracks the relationship between moving averages. To use MACD properly, you need a clear understanding of the three components that make up MACD.
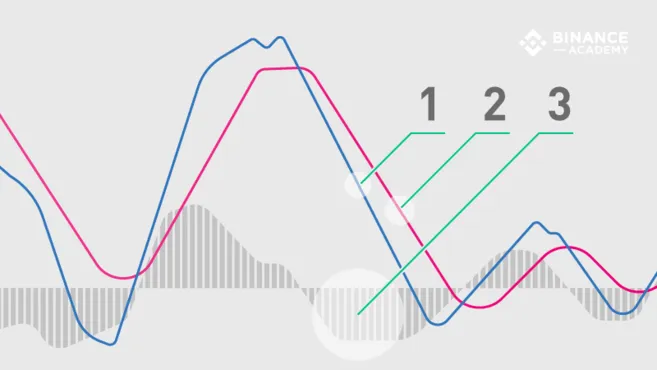
1. MACD Line
The MACD indicator uses exponential moving averages (EMAs) and is usually set to 12 periods (the fast line) and 26 periods (the slow line). These periods are the common setting, but you can adjust them to suit different trading strategies.
The formula for the MACD line is as follows. The MACD line is created by subtracting the 26-day EMA from the 12-day EMA.
MACD line = 12-day EMA - 26-day EMAThe MACD line oscillates above and below the central zero line, telling traders when the relative positions of the 12-day and 26-day EMAs change.
2. Signal Line
By default, the signal line uses the 9-day EMA of the MACD line and provides additional insight into previous movements.
Signal line = 9-day EMA of the MACD lineWhen the MACD line and the signal line cross, this is generally regarded as a trend reversal signal. It is especially meaningful when it happens at the extremes of the MACD chart (far above or below the center line).
3. MACD Histogram
The histogram is a visual record of the relative movement between the MACD line and the signal line. The MACD histogram is calculated with the following formula.
MACD histogram = MACD line - signal lineBecause the histogram is drawn as a bar chart, it is easier to read and interpret visually. However, the histogram bars have nothing to do with the asset's trading volume.
How to Set Up MACD (Default Settings)
The default MACD setting is based on 12-, 26- and 9-period EMAs, that is, MACD(12, 26, 9). However, some chart analysts and chart experts change the periods to make the indicator more sensitive. For example, MACD(5, 35, 5) is a setting used in traditional financial markets for longer time frames such as weekly or monthly charts. Keep in mind, though, that making the MACD indicator more sensitive can produce more false signals and misleading information, so be careful.
How to Use MACD
One of the important signals from the MACD indicator is the crossover signal. You can look for trading opportunities when the MACD line crosses above or below the center (zero) line, or when it crosses the signal line.
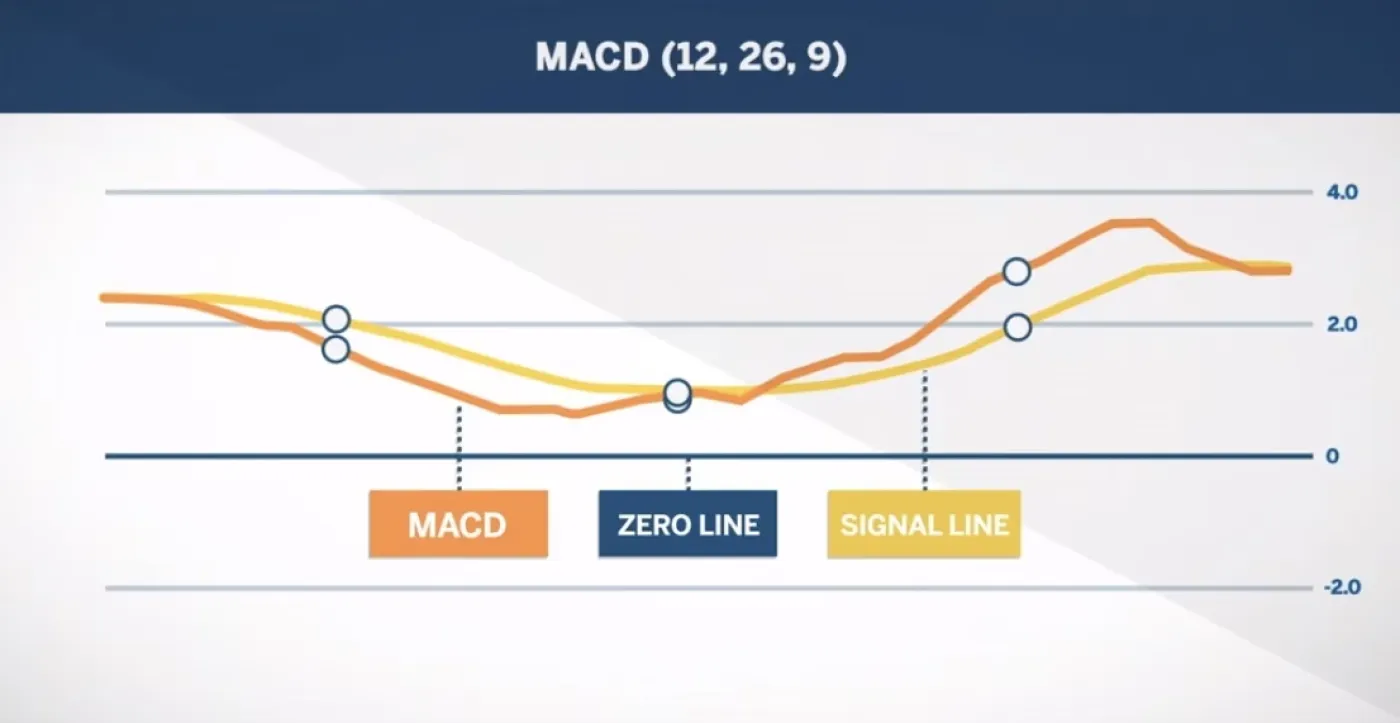
1. Center Line Crossover
A center line crossover is when the MACD line moves into positive or negative territory relative to the zero line. A positive MACD value, crossing above the central zero line, indicates that the 12-day EMA is greater than the 26-day EMA. Conversely, when the MACD line crosses below the center line, the MACD turns negative, which means the 26-day average is higher than the 12-day average.
To sum up, a positive MACD line means upward momentum is strong, and a negative one means downward momentum is strong.
2. Signal Line Crossover
When the MACD line crosses above the signal line, traders often interpret it as a buying opportunity. On the other hand, when the MACD line crosses below the signal line, traders tend to see it as a selling opportunity.
However, signal line crossovers are not always reliable. When using them, you should take market conditions and additional analytical factors into account.
For example, if an upward crossover occurs while the MACD line is below the center line, it may still indicate a bearish situation. Conversely, even if a downward crossover occurs, the situation may be bullish if the MACD line is positive (above the zero center line). In cases like these, it can be safer to consider the bigger trend when making trading decisions.
3. MACD and Price Divergence
On a MACD chart, along with center line and signal line crossovers, you can identify divergences by watching MACD and price movements together.
Here is an example of bearish divergence. While the price is rising, MACD falls and makes lower highs. This shows that the price rally is weakening and buying pressure is declining, and it can be seen as a signal of a price reversal (downward).
Conversely, here is an example of bullish divergence. While the price is falling, MACD rises and makes higher lows. This means buying pressure is increasing despite the falling price, and it can be seen as a signal of a price reversal (upward).
Final Summary
MACD is one of the truly useful tools in technical analysis. It helps you identify market trends and momentum. Like other technical analysis indicators, though, it is not 100% accurate. False signals can occur, especially with highly volatile assets or in weak trends and sideways markets.
To reduce these risks, many traders use MACD together with other indicators. For example, when combining MACD with the RSI indicator and Bollinger Bands, you can check MACD's signal and then confirm the RSI and Bollinger Band conditions as supporting evidence before trading. This kind of combination can help filter out MACD's false signals.


