Golden Cross and Death Cross: What They Are and How to Use Them
6 min read · · Korean original
Contents 6
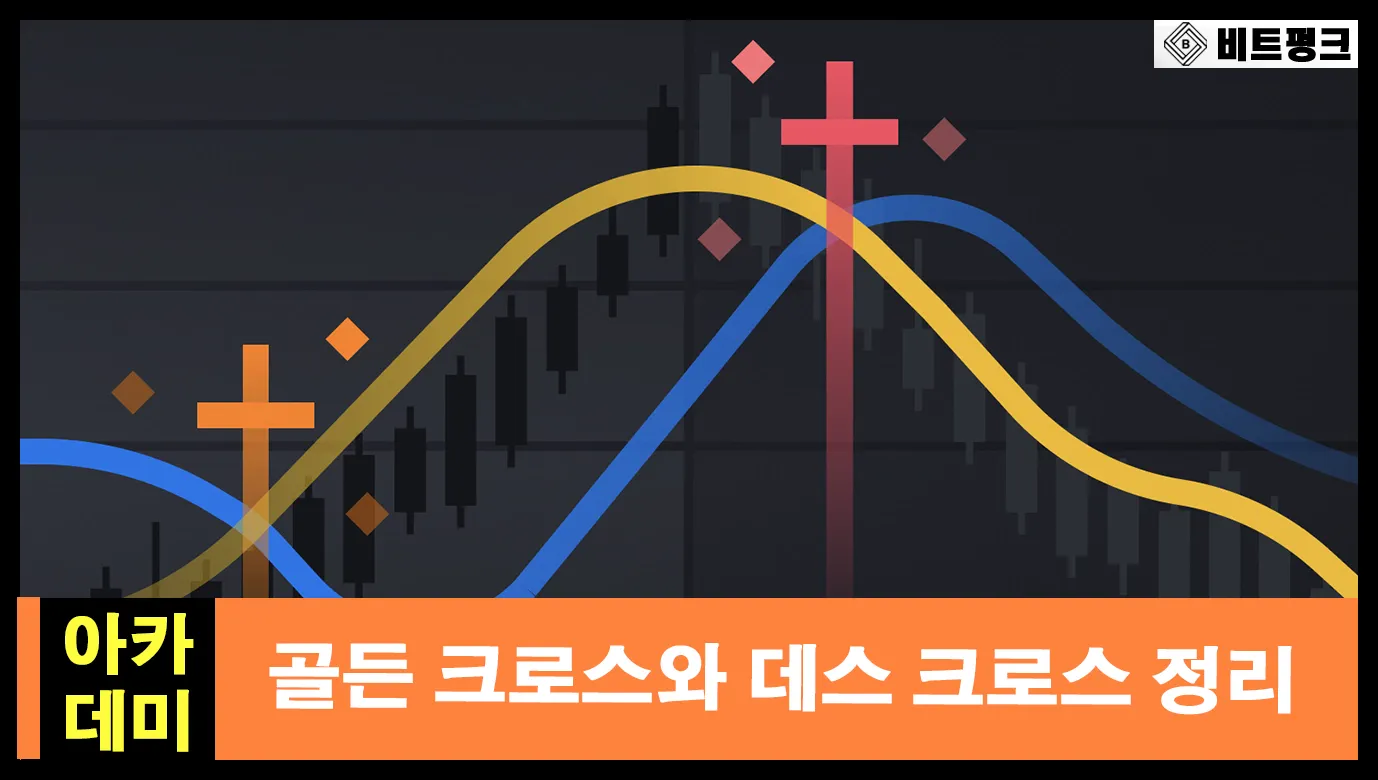
What are the golden cross and the death cross, and how can you use them in your trading strategy? In this post, we'll look at what these two crossover signals are and how they differ, along with a detailed guide on how to use them and what to watch out for. Ready?
The Basics of the Golden Cross and Death Cross: Understanding Moving Averages
Before we look at what the golden cross and death cross are, you need to understand what a moving average (MA) is. Simply put, a moving average is a line drawn on a price chart that measures an asset's average price over a specific period.
For example, the 200-day moving average, one of the most important lines in financial markets, measures an asset's average price over the past 200 days.
Once you understand what a moving average is, the golden cross and death cross are easy to grasp. If you're not familiar with it, please follow the links I've included above and read those articles first before coming back.
Golden Cross vs. Death Cross: Key Differences
Here's how the golden cross and death cross compare.
| Golden Cross | Death Cross | |
| Signal | Bullish signal | Bearish signal |
| Pattern | Short-term MA crosses above | Short-term MA crosses below |
| Periods | 50-day and 200-day moving averages | 50-day and 200-day moving averages |
| Meaning | Short-term price action is strong | Short-term price action is weak |
| Trend | Uptrend begins or strengthens | Downtrend begins or strengthens |
| Strategy | Mainly a buy signal | Mainly a sell signal |
Does that make some sense? If not, that's okay. We're now going to take a closer look at these two crossover signals. What exactly are the golden cross and the death cross, and how can you use them?
What Is a Golden Cross?
A golden cross (also called a gold cross or golden crossover) is a chart pattern in which a short-term moving average crosses above a long-term moving average. Take a look at the image below.
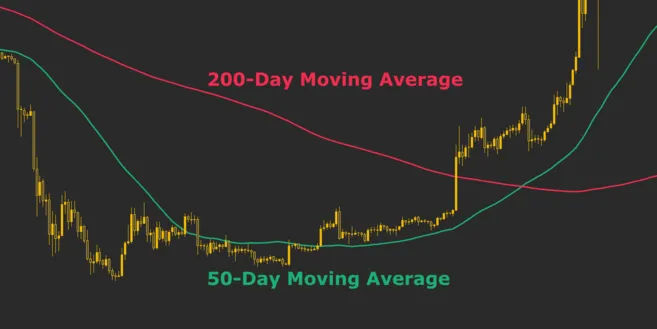
The 50-day moving average is usually treated as the short-term average and the 200-day moving average as the long-term average. The key to a golden cross is the short-term average rising above the long-term average.
A golden cross unfolds in the following three stages.
- During a downtrend, the short-term moving average stays below the long-term moving average.
- The trend reverses and the short-term moving average crosses above the long-term moving average.
- The short-term moving average keeps staying above the long-term moving average, and the uptrend continues.
A golden cross can indicate a bullish signal. It means the short-term average price is rising above the long-term average price, showing that the direction of the market trend is changing.
With golden crosses, signals on higher timeframes (1 day, 1 week, etc.) are more reliable than signals on lower timeframes (1 hour, 15 minutes, etc.).
Also, golden crosses are sometimes identified using exponential moving averages (EMA) as well as simple moving averages (SMA). The EMA reacts more quickly to recent price action and so gives crossover signals sooner, but it can also produce more false signals. Even so, some traders still prefer the faster golden cross signals from the EMA.
What Is a Death Cross?
A death cross (also called a dead cross) is the opposite of a golden cross: a chart pattern in which a short-term moving average crosses below a long-term moving average. Take a look at the chart below.
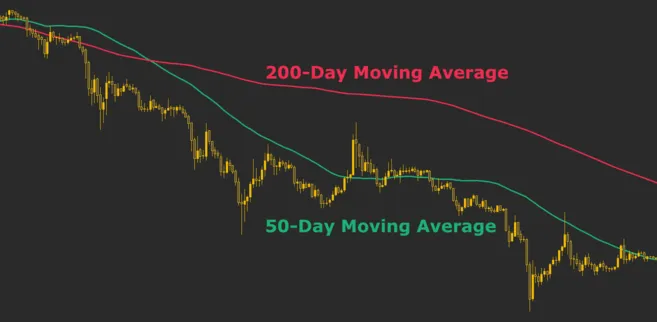
A death cross usually refers to the 50-day moving average crossing below the 200-day moving average. For this reason, a death cross is considered a bearish signal.
A death cross unfolds in the following three stages.
- During an uptrend, the short-term moving average stays above the long-term moving average.
- The trend reverses and the short-term moving average crosses below the long-term moving average.
- The short-term moving average stays below the long-term moving average, and the downtrend continues.
A death cross signals weakness. As the short-term average drops below the long-term average, it shows that a downtrend is taking shape.
Trading Strategies Using the Golden Cross and Death Cross
So far, we've covered how the golden cross and death cross are chart patterns commonly used in technical analysis and are based on moving averages. Now let me briefly explain how to trade using these crossover signals.
Golden Cross and Death Cross Trading Strategies
- Golden cross buy strategy: Buy when the short-term moving average crosses above the long-term moving average. This can signal the start of an uptrend.
- Death cross sell strategy: Sell when the short-term moving average crosses below the long-term moving average. This can signal the start of a downtrend.
Choosing Different Chart Timeframes for More Signals
- Crossover strategies are usually based on the daily chart. However, you can also use golden crosses and death crosses on other timeframes, such as the 4-hour, 1-hour, and 15-minute charts. This lets you catch more crossover signals.
- Keep in mind, though, that the lower the timeframe, the less reliable the crossover signals become.
Checking Trading Volume
- Trading volume is one of the key factors in confirming a golden cross or death cross.
- When a crossover is accompanied by high trading volume, the signal is more reliable.
Using Confluence
- It's a good idea to use crossover signals together with other indicators.
- Confluence traders combine multiple signals and indicators into a single trading strategy to increase the reliability of their trade signals.
Understanding the Broader Market Conditions
- Trading on crossover strategies alone can be risky.
- It's best to carry out a comprehensive, big-picture market analysis and consider a variety of factors together when building your investment and trading strategy.
Crossover signals are used by many traders, but relying on them alone can be risky. So combine them with other technical indicators and market analysis to make a well-rounded judgment, and always have a risk management strategy in place to build an effective trading strategy.
Wrapping Up
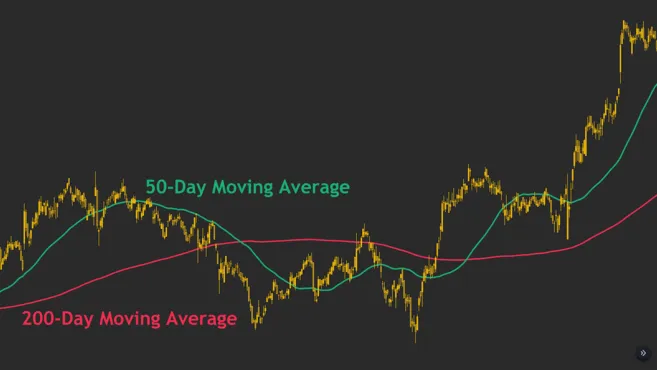
The golden cross and the death cross are both crossover signals based on moving averages. They become more reliable when observed with high trading volume and on larger timeframes, and using them together with other technical indicators and the overall market environment is safer and more effective.
However, don't forget that moving averages are lagging indicators: they're useful tools for confirming trend reversals that have already happened, but they don't predict the future. Whenever you invest or trade, it's wise to have a risk management strategy in place, such as working out your risk-reward ratio, and to enter the market carefully.
That wraps up our look at what the golden cross and death cross are and how to use them. If you found this article helpful, please tap the heart below and share it widely so other traders can see it too. Thank you!


