5 Popular Technical Indicators Recommended for Trading
6 min read · · Korean original
Contents 7
Which technical indicators are best to watch when you trade? In this post, we'll look at 5 popular indicators recommended by traders and go over how to use them.
The 5 Indicators Traders Use Most
- RSI (Relative Strength Index): RSI is an oscillator used to identify whether an asset is overbought or oversold. It measures relative strength based on the rises and falls in an asset's price.
- Moving Average: A moving average identifies the trend through the average movement of price over a specific period. A cross between a short-term moving average and a long-term moving average can serve as a buy or sell signal.
- MACD (Moving Average Convergence Divergence): MACD is used to identify moving average crosses and the direction of a trend.
- Stochastic RSI: Stochastic RSI identifies the relative level of price over a given period. This lets you assess overbought or oversold conditions.
- Bollinger Bands: Bollinger Bands estimate and display the range between an upper and lower limit of an asset's price.
1. Relative Strength Index (RSI)
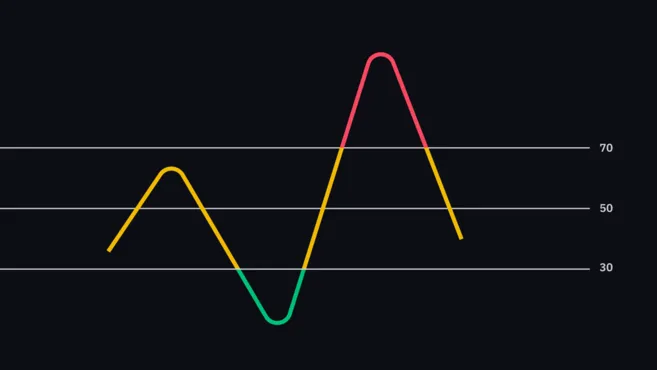
The Relative Strength Index (RSI) is a momentum indicator that shows whether an asset is overbought or oversold. It measures price changes over a specific period (days, hours, etc.), and 14 periods is typically used.
RSI takes values between 0 and 100. The basic way to read RSI is that an asset is overbought when it goes above 70, and oversold when it falls below 30.
However, simply using RSI values as buy or sell signals is risky. If momentum increases while price is rising, it can be a sign that the uptrend is getting stronger and more buyers are entering the market. Conversely, if momentum decreases while price is rising, it may indicate that sellers could take control of the market.
If you'd like to learn more about RSI, check out our Relative Strength Index (RSI) article.
2. Moving Average (MA)
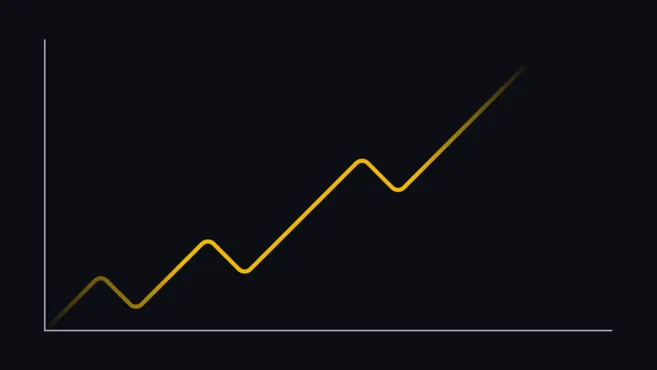
A moving average is calculated from the average of past price data. There are two main types of moving averages.
- Simple Moving Average (SMA or MA): Uses the average price over a specific period. For example, a 10-day SMA calculates and shows the average price over the last 10 days.
- Exponential Moving Average (EMA): Calculated by giving more weight to recent price data.
The longer the period, the more slowly a moving average updates. For example, the 200-day MA reacts more slowly to recent price movements than the 50-day MA.
Traders can use the relationship between price, volume, and specific moving averages to judge the current market trend. When price stays above the 200-day MA, the asset is often considered to be in a bull market.
Moving average crossovers are another method traders use. For example, when the 100-day MA crosses below the 200-day MA, it may be a sell signal.
For more details, check out our article on moving averages.
3. Moving Average Convergence Divergence (MACD)
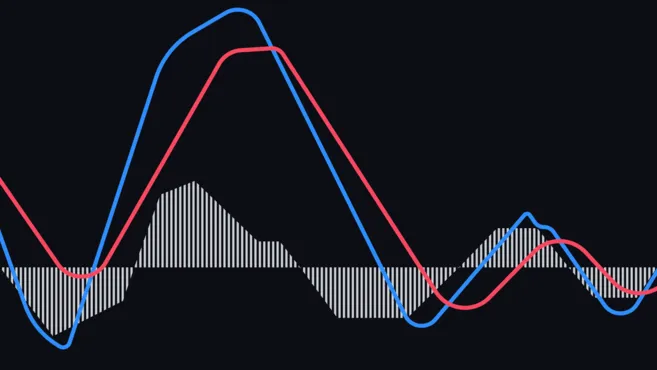
MACD (Moving Average Convergence Divergence) is an indicator that gauges an asset's momentum through the relationship between two moving averages.
Because MACD shows divergence from price movement, it helps you gauge the strength of the current trend. For example, if price is making highs while MACD is showing lows, it may mean the market could reverse. In other words, if price rises while momentum is fading, the trend may reverse and a decline may begin.
You can also use crosses between the MACD and the signal line. When the MACD line crosses above the signal line, it can be considered a buy signal, and when the MACD line crosses below the signal line, it can be considered a sell signal.
MACD measures momentum, but it is often used together with other indicators such as RSI. For more details, please refer to our article on MACD.
4. Stochastic RSI
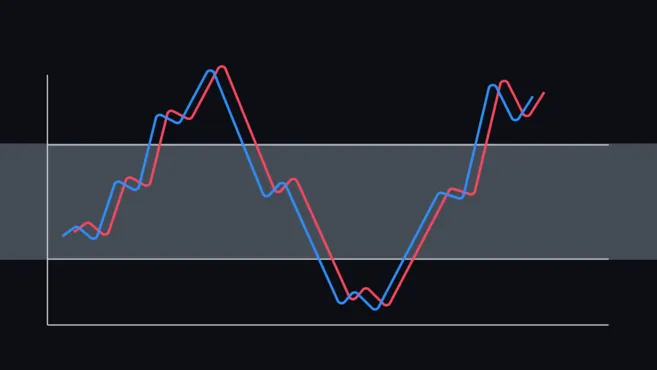
Stochastic RSI is a momentum oscillator used to determine whether an asset is overbought or oversold. It is derived from RSI and is created by applying the stochastic formula to RSI values instead of to price. Stochastic RSI values typically range from 0 to 1 (or from 0 to 100).
Because Stochastic RSI is fast and highly sensitive, it can generate many trading signals and can be tricky to interpret. It is generally known to be most useful when its value is near the top or bottom of the range.
Typically, a Stochastic RSI above 0.8 is considered overbought, and below 0.2 is considered oversold. A value of 0 means RSI is at its lowest level within the measurement period (the default setting is usually 14), and a value of 1 means RSI is at its highest level within the measurement period.
However, just like RSI, an overbought or oversold Stochastic RSI reading does not guarantee that the price trend will reverse. Stochastic RSI simply means that the RSI value has moved close to an extreme within the recent period. Also keep in mind that because Stochastic RSI is more sensitive than the RSI indicator, false signals can occur more often.
For more details, check out our article on Stochastic RSI.
5. Bollinger Bands
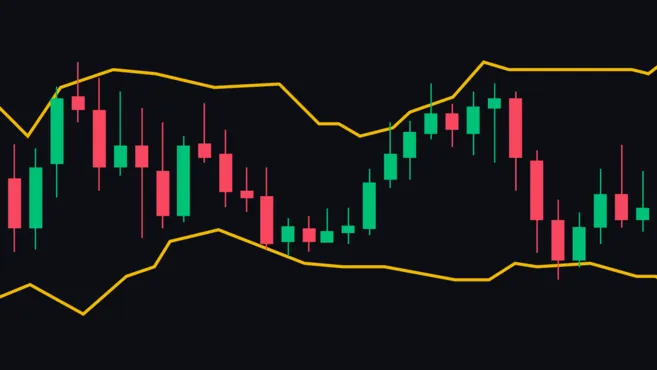
Bollinger Bands are a technical indicator used to measure market volatility as well as overbought and oversold conditions. Bollinger Bands consist of three lines: the middle band (SMA), the upper band, and the lower band.
With Bollinger Bands, the distance between the bands widens as volatility increases and narrows as volatility decreases.
The closer price is to the upper band, the more likely the asset is overbought. Conversely, the closer price is to the lower band, the more likely it is oversold. In most cases price moves within the bands, but it can break out above or below them. Such breakouts can be seen as signals of extreme market conditions.
Another important concept is the Bollinger Band "squeeze." This refers to a low-volatility, sideways period in which all the bands move very close together. In such cases, a big price move may follow, with the bands pulling apart from each other as the squeeze plays out.
For more details, check out our article on Bollinger Bands.
Wrapping Up
Technical analysis indicators are based on data, but the way they are interpreted is highly subjective. Since every trader has their own analysis methods and investment style, the same indicator can be interpreted differently. That's why traders should always pay close attention to whether their own biases and emotions are influencing their decisions.
That wraps up our look at 5 recommended trading indicators. If you're a beginner trader, we also recommend checking out the post below.
How to Trade Well and 7 Mistakes Beginner Traders Make6 min read

