How to Trade the Hammer Candlestick Pattern (Hammer/Inverted Hammer Strategy)
3 min read · · Korean original
Contents 5
The hammer candlestick pattern is one of the most widely used patterns in technical analysis. It is used not only in Bitcoin trading but also in stocks, indices, bonds, and forex.
The hammer candlestick pattern helps you spot trend reversals at the end of an uptrend or downtrend. The so-called hammer and inverted hammer patterns are not right 100% of the time, but combined with other indicators, you can use them to enter long and short positions.

What Is a Candlestick Pattern?
A candlestick is a visual representation of price movement over a specific period, and these candles come together to form patterns. Many traders use candlestick patterns to analyze price movements in the market. If you'd like to learn about various candlestick patterns and the basic concepts, check out the post below.
 What Are Candlestick Patterns and How Can You Use Them?9 min read
What Is the Hammer Candlestick Pattern?
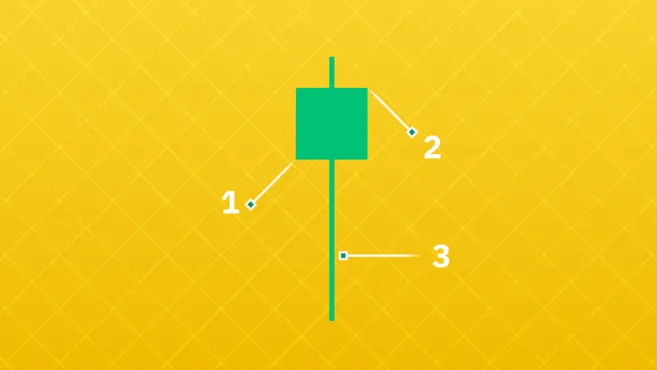
A hammer candlestick is a candle with a small body and a long upper or lower wick. In the image below, you can see a hammer candle formed by the open (1), the close (2), and the wick (3). The wick should be at least twice as long as the body. If the lower wick is long, it means sellers pushed the price down, and then buyers pushed it back up.
How to Spot Trend Reversals with the Hammer Candlestick Pattern
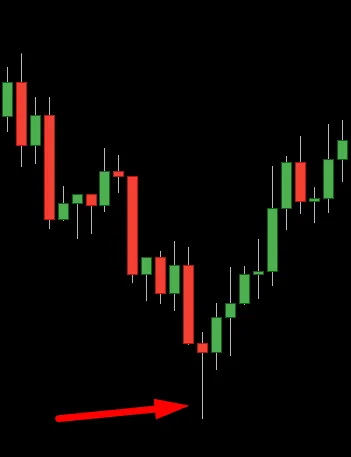
A bullish hammer candle appears in a downtrend and signals a trend reversal at the bottom of the downtrend. This is where you could go long or buy. The example below shows a bullish hammer candle.
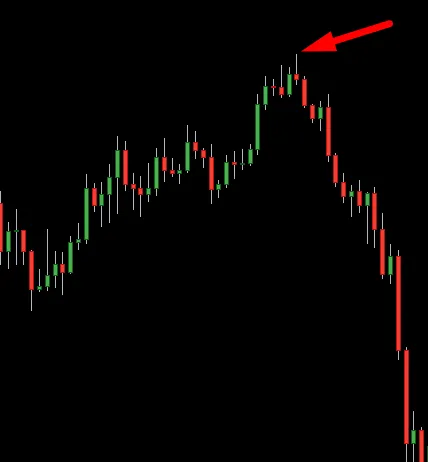
A bearish hammer candle appears after an uptrend and signals a possible reversal into a downtrend. This is where you could go short or sell. The example below is a shooting star, one type of bearish hammer candle.
To trade using hammer candles, you also need to consider the previous and following candles. A hammer-type trend reversal pattern may or may not be valid depending on the situation. That's why it's important to look carefully at each type of hammer candle.
Strengths and Weaknesses of the Hammer Candlestick Pattern
Every candlestick pattern has its pros and cons. In the market, no technical analysis tool or indicator can guarantee profits 100% of the time. The hammer candlestick pattern tends to be more effective when combined with other trading strategies such as moving averages, trendlines, RSI, MACD, and Fibonacci.
Strengths
- The hammer candlestick pattern can be used to spot trend reversals in any financial market.
- Traders can use the hammer pattern across multiple chart timeframes, making it useful for both swing trading and day trading.
Weaknesses
- The hammer candlestick pattern can mean different things depending on the situation, and there is no guarantee that a trend reversal will occur.
- On its own, the hammer candlestick pattern is not very reliable, so it should be used together with other strategies and tools to improve your odds of success.
Final Summary
The hammer candlestick pattern is a useful tool that helps traders spot potential trend reversals, but you shouldn't buy or sell based on this pattern alone. Candlestick patterns are more effective when used together with moving averages, trendlines, RSI, MACD, Fibonacci, and so on, and the final decision is up to the trader. That's exactly why risk management matters more than anything else in trading.
That wraps up our look at the hammer and inverted hammer candlestick patterns.


