Support and Resistance: What They Are and How to Use Them
6 min read · · Korean original
Contents 7
Support and resistance are fundamental and important concepts in technical analysis, and they come in handy in all kinds of trading situations. They are easy to understand, but using them well in practice takes some practice.
What Are Support and Resistance?
Support and resistance are simpler than you might think. If there is a level that the price can't break through, it acts as a kind of support or resistance. Basically, it's seen as a point where buyers and sellers battle it out. What does that mean?
Support is a "floor" below which the price doesn't fall, and resistance is a "ceiling" above which the price doesn't rise. Does that make sense?
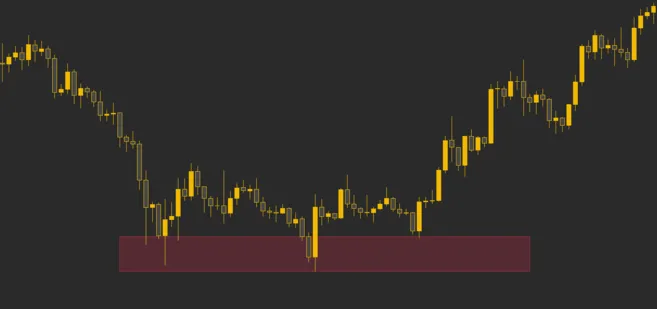
Here is an example of support. The asset's price held up instead of falling, forming a support level. As a result, the price can bounce and a new uptrend may begin.
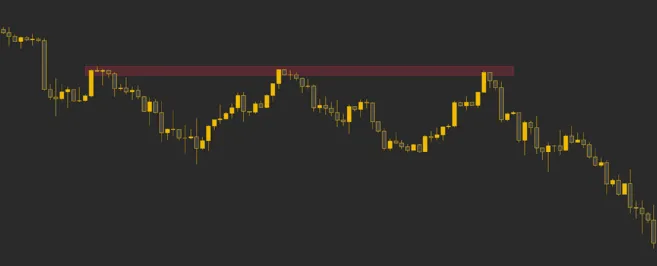
Next, let's look at resistance. As shown in the chart below, the price is in a downtrend. However, the price can't climb higher and keeps falling back down. That price range is a resistance zone.
How to Use Support and Resistance
Market psychology plays a big role in forming support and resistance levels. Since many traders may be watching the same support and resistance levels, these zones can be good places for large traders (or whales) to enter or exit positions.
Support and resistance are key concepts for proper risk management. If you can identify support and resistance well, you may be able to catch good trading opportunities.
 The Core of Bitcoin Futures Risk Management (The 5% Rule and How to Set Leverage)4 min read
Generally, when the price reaches a support or resistance zone, it may bounce off that zone, or break through it and keep moving in the direction of the trend toward the next support or resistance zone. If neither happens, you can place a stop loss at the point where your strategy becomes invalid and get out with a small loss.
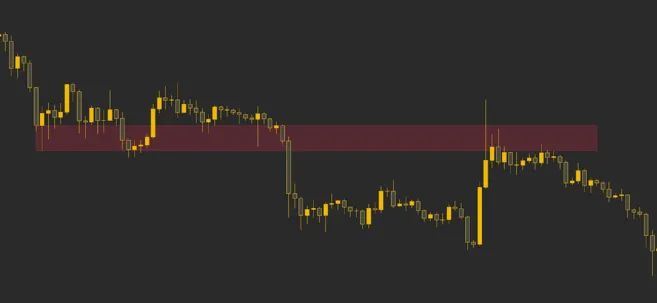
Another thing to consider is how these support and resistance levels change as conditions change. Generally, when a support zone breaks, it becomes a resistance zone. Conversely, when a resistance zone breaks, it can turn into a support zone when it's retested later. This pattern is sometimes called a support-resistance flip.
Another consideration is the strength of the support or resistance zone. Generally, the more times the price falls and retests a support level, the more likely it is to break down. Likewise, the more times the price rises and retests a resistance zone, the more likely it is to break out to the upside.
So far, we've looked at how support and resistance are used in price action. So what types of support and resistance are there? Let's go over a few of them.
Psychological Support and Resistance
The first type we'll look at is psychological support and resistance. This is support and resistance that arises from the way humans try to make sense of the world.
We live in an incredibly complex world. Would you agree? To understand it better, we unconsciously try to simplify the world around us. The most common example is how we process numbers conceptually. Have you ever wanted to eat 0.7648 of an apple? Or have you ever asked a restaurant for 13,678,254 grains of rice?
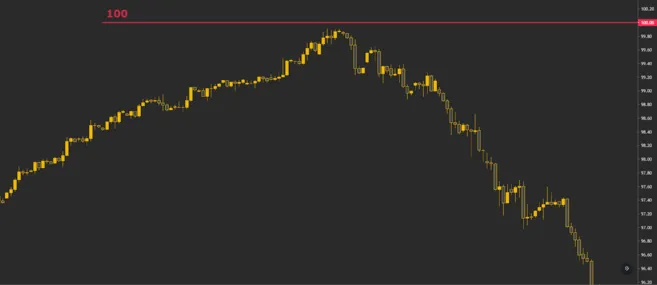
Something similar happens in financial markets. Buying Bitcoin at $28,412.0674 and selling it at $29,389.9765 feels very different from buying at $28,000 and selling at $30,000. For psychological reasons, those round price levels can act as support and resistance zones on the chart.
Take a look at the example below. As the US Dollar Index, DXY, approached 100, some traders placed sell orders just below that level to make sure their orders got filled. Because many traders were expecting a reversal at 100 and keeping a close eye on that level, the market effectively never reached it and reversed just before it.
Trendline Support and Resistance
If you're familiar with classic chart patterns, you can spot an ascending triangle with trendline support in the example below. In an ascending triangle, the price stays capped until it breaks out to the upside. Then it breaks through the resistance zone and rises.
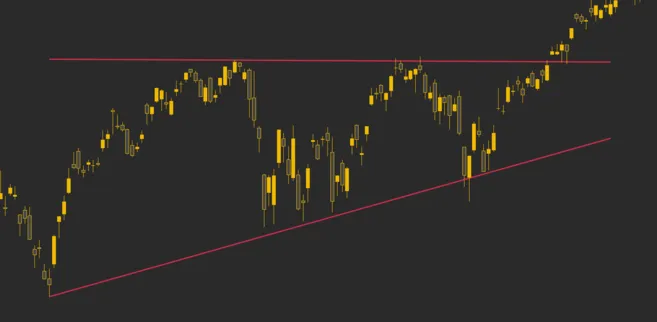
Using patterns like this, you can identify support and resistance zones along with trendlines. This can be especially useful if you spot the pattern before it completes.
Moving Average Support and Resistance
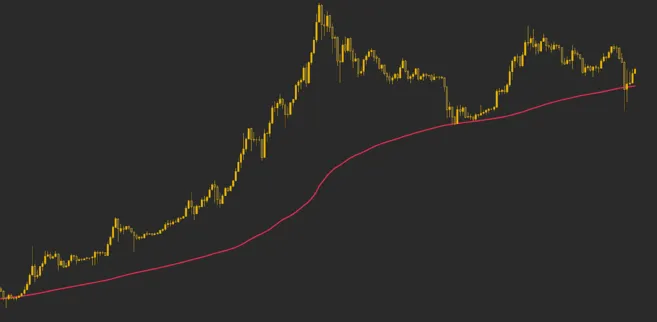
Moving averages act as support or resistance for the price. Many traders use moving averages to gauge the market trend. Key levels such as the 200-day moving average can be useful for catching trend reversals or pivot points.
Fibonacci Support and Resistance
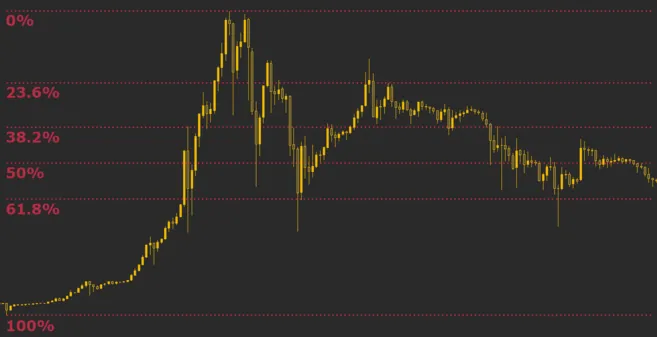
The levels we covered with the Fibonacci retracement tool can also act as support and resistance. In the example below, the 61.8% Fibonacci level acts as support several times, while the 23.6% level acts as resistance.
 Fibonacci Retracement Fully Explained5 min read
Putting Technical Analysis Together
So far, we've covered what support and resistance mean and the different types. So what's the best way to build a trading strategy based on them?
The key idea to understand here is confluence. Confluence means combining several strategies into a single strategy. Let's look at two examples. Which support zone do you think is more likely to actually act as support?
| Support Level Examples | |
|---|---|
| Support 1 | Previous resistance zone Important moving average crossover 61.8% Fibonacci level Psychological price level |
| Support 2 | Previous resistance zone Psychological price level |
Support 1 is more likely than Support 2 to actually act as support. As this shows, to make good use of support and resistance, it's best to combine them with other indicators and strategies.
Good confluence can lead to good profits. However, when trading in a highly volatile crypto market like Bitcoin, it's important to manage your risk and minimize your losses.
If you're a beginner who isn't yet used to trading, check out the article below on the 7 most common mistakes beginners make and work on improving them.
How to Trade Well and 7 Mistakes Beginner Traders Make6 min readWrapping Up
Whether you're day trading or swing trading, support and resistance are basic concepts in technical analysis that you need to understand. Support acts as a floor for the price, and resistance acts as a ceiling.
Support and resistance can take many forms, such as psychological levels, trends, and moving averages. Don't forget that support and resistance work best when used together with other indicators and analysis.
That wraps up our look at what support and resistance mean and how to use them in trading. Thank you for reading. If you found this post helpful, please tap the heart below and share it widely.


