
What Is the Ichimoku Cloud and How to Read It
6 min read · · Korean original
Contents 6
The Ichimoku Cloud was created in the late 1930s by a Japanese journalist named Goichi Hosoda. After decades of research and technical refinement, Hosoda finally published the Ichimoku Cloud in 1969.
Hosoda called it Ichimoku Kinko Hyo, meaning "one-glance equilibrium chart." So what is the Ichimoku Cloud, and how can you use it?
Components of the Ichimoku Cloud
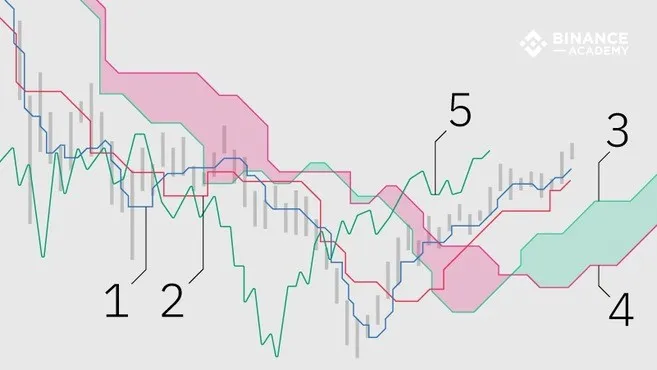
The Ichimoku Cloud system displays data based on leading and lagging indicators and is made up of the following five lines.
- Conversion Line: 9-period moving average.
- Base Line: 26-period moving average.
- Leading Span A: moving average of the Conversion Line and Base Line, projected 26 periods ahead.
- Leading Span B: 52-period moving average, projected 26 periods ahead.
- Lagging Span: the current period's closing price, plotted 26 periods back.
Yes, the Ichimoku Cloud has a lot of lines. But interpreting it is simpler than you might think. First, let's look at how to read the cloud, which is the key to using the Ichimoku Cloud.
How to Read the Cloud, the Core of the Ichimoku Cloud
The most notable element of the Ichimoku Cloud is the cloud itself, which refers to the space between Leading Span A and Leading Span B. When Leading Span A (the green cloud line) is above Leading Span B (the red cloud line), a green cloud forms.
By default, the cloud is shown in green or red, so it's easy to spot. A green cloud can be read as a sign that the market is in an uptrend. A red cloud, on the other hand, can be read as a sign that the market is in a downtrend.
In addition, Leading Span A (the green cloud line) acts as support in an uptrend and as resistance in a downtrend. When the price moves into the cloud, Leading Span B (the red cloud line) can act as support or resistance.
Leading Spans A and B are considered leading indicators because they offer insight by projecting 26 periods into the future. With Leading Span A and Leading Span B projecting the next 26 periods, you can anticipate future price movements and identify potential support and resistance levels.
Signals Generated by the Ichimoku Cloud
Trading signals generated by the Ichimoku Cloud can be broadly divided into momentum signals and trend-following signals.
Momentum signals:
- A bullish momentum signal forms when the market price moves above the Base Line and/or the Conversion Line.
- A bearish momentum signal forms when the market price moves below the Base Line and/or the Conversion Line.
- When the Conversion Line crosses the Base Line, it's called a TK cross.
Trend-following signals:
- These are generated based on the color of the cloud and the market price. The color of the cloud reflects the difference between Leading Spans A and B.
- When the price is above the cloud, the asset is likely in an uptrend.
- When the price moves below the cloud, it can be read as a bearish signal pointing to a downtrend.
- When the price moves sideways inside the cloud, the trend can be considered flat or neutral.
Lagging Span:
- A lagging indicator that helps you spot potential trend reversals and confirm the strength of a trend.
- When it moves above the market price, it indicates an uptrend; when it moves below, it indicates a downtrend.
By combining these Ichimoku signals, traders can gauge the direction and strength of a trend and make appropriate trading decisions depending on the situation.
How to Set Up the Ichimoku Cloud
Note that, unlike other methods, the moving averages used in the Ichimoku strategy are not based on candle closing prices. Instead, the Ichimoku price averages are calculated from the highs and lows recorded within a given period.
For example, the standard Ichimoku formula for the 9-day Conversion Line is as follows.
Conversion Line = (9-day high + 9-day low) / 2
Goichi Hosoda determined that the (9, 26, 52) Ichimoku settings produced the best results. At the time, Japanese markets were open on Saturdays, so the number 9 represented a week and a half (6 days + 3 days). The numbers 26 and 52 represented one month and two months, respectively.
These settings may still work well in most cases, but in crypto markets such as Bitcoin, the Ichimoku settings are often changed from (9, 26, 52) to (10, 30, 60) to reflect the market's 24/7 trading. Some go even further and adjust the settings to (20, 60, 120) to reduce false signals.
However, there is still debate over how effective it is to modify the settings. Some argue that adjusting the settings makes sense, while others argue that sticking with the standard settings is more effective at reducing false signals. In the end, whether to change the Ichimoku settings comes down to each trader's judgment and strategy.
Drawbacks of the Ichimoku Cloud and How to Overcome Them
The strength of the signals generated by the Ichimoku Cloud depends heavily on whether they align with the main trend. Signals are stronger and more reliable when they align with the main trend.
When a bullish signal doesn't align with a bullish trend, it can be confusing. That's why it's important to accurately check the color and position of the cloud every time a signal appears. You should also consider trading volume. When a signal occurs alongside high volume, the reliability of that signal can increase.
Also, using the Ichimoku Cloud on short timeframes (e.g., hourly charts) can produce noise and false signals. Using longer timeframes (e.g., weekly or monthly charts) can give you more reliable momentum and trend-following signals. So it's important to choose an appropriate timeframe to confirm signals that align with the main trend.
Final Summary
Goichi Hosoda put a great deal of effort into developing and refining the Ichimoku Cloud system over many years, and today it is used by millions of traders around the world.
The Ichimoku Cloud is used to identify various chart patterns and momentum, and because it uses leading spans, it helps you anticipate future prices and potential support and resistance levels.
An Ichimoku chart may look very complex at first, but unlike other technical analysis methods such as trendlines, it doesn't rely on subjective judgment.
However, like other technical indicators, the Ichimoku Cloud is best used alongside other techniques rather than on its own. This helps you confirm trends and manage trading risk.
Also, since Ichimoku charts can look complicated to beginners, new traders may want to get comfortable with more basic technical indicators first.
That wraps up our look at the Ichimoku Cloud. If you found this article helpful, please tap the heart below and share it widely. Thank you.


