The Wyckoff Method Explained: Patterns, Charts, and Laws. Does the "Composite Man" Really Exist?
9 min read · · Korean original
Contents 6
Wyckoff was an American investment analyst who developed the method that bears his name, the Wyckoff Method, in the 1930s. He drew a great deal of inspiration from studying the legendary investor Jesse Livermore. Nearly a century has passed since Wyckoff developed this method, yet it remains one of the popular trading strategies widely used today.
Wyckoff's 3 Laws
The Wyckoff methodology is built on 3 main laws. The first is the law of supply and demand, the second is the law of cause and effect, and the third is the law of volume.
Based on these 3 fundamental laws, the Wyckoff Method helps traders and investors identify market trends and reversal points and make better investment decisions.
1. The Law of Supply and Demand
The first law is simple and self-evident: when demand exceeds supply, prices rise, and when demand falls short of supply, prices fall. This is one of the most basic principles of any market.
Wyckoff visualized the relationship between supply and demand by comparing price movement with volume, and he stressed that it is important to use this to read market moves before they happen.
- Demand > Supply = Price rises
- Demand < Supply = Price falls
- Demand = Supply = No significant price change (low volatility)
In this way, Wyckoff's first law is a simple yet clear logic: when buying pressure is stronger than selling pressure, the price goes up. Conversely, when there is more selling than buying, supply exceeds demand and the price goes down. I'm sure you already know this much.
2. The Law of Cause and Effect
The second is the law of cause and effect. It states that supply and demand don't arise at random; they emerge as the result of specific events, after a long period of preparation. Wyckoff argued that there must be a sideways accumulation period (cause) and a gradual distribution period (cause) before there can be an uptrend (effect) and a downtrend (effect).
3. The Law of Volume
Wyckoff's third law is that the volume accompanying a change in an asset's price is extremely important. If a price move is accompanied by volume, the trend is likely to continue. However, if a price move is not accompanied by volume, the market trend is more likely to stall or reverse.
For example, let's say the Bitcoin market starts seeing high volume after a long bearish trend. If the price still moves sideways and doesn't budge despite the high volume, this may mean the bear market will soon end and a reversal could be near.
Wyckoff and the Big Players (The Composite Man)
The Composite Man (the big players) is a hypothetical market entity proposed by Wyckoff, conceptualizing the market as if it were controlled by a single entity. In Korean, this is also called "세력" (the big players) or "큰 손" (whales). The Composite Man always acts in his own interest, buying at low prices and selling at high prices.
The Composite Man typically behaves differently from ordinary retail investors, and as a result, he sometimes takes losses too. However, Wyckoff believed the Composite Man uses strategies that are predictable to some degree, and argued that investors can identify them.
Wyckoff uses the Composite Man concept to explain market cycles. These cycles consist of four main phases.
- Accumulation: The Composite Man accumulates the asset before most investors do. This phase usually takes place in a sideways market, and he accumulates gradually so the price doesn't move significantly.
- Uptrend: After accumulating, the Composite Man begins pushing the market up. During the uptrend, new investors start buying and demand increases.
- Distribution: Once the uptrend reaches a certain level, the Composite Man begins selling the assets he holds. In this phase, the market moves sideways until demand is exhausted.
- Downtrend: When the distribution phase ends, the market turns into a downtrend. As the Composite Man sells his assets, a decline takes shape and supply comes to exceed demand.
Both uptrends and downtrends may include a redistribution phase, which refers to a temporary period of sideways movement. These cycles repeat, keeping the market in constant motion. Understanding the Composite Man's behavior can help you identify market trends.
Wyckoff Patterns and Charts
The accumulation and distribution schematics are among the most popular parts of the Wyckoff patterns. Wyckoff's chart patterns can be explained through the following phases. First, let's look at the pre-rally accumulation chart.
1. Pre-Rally Accumulation Chart (Accumulation)
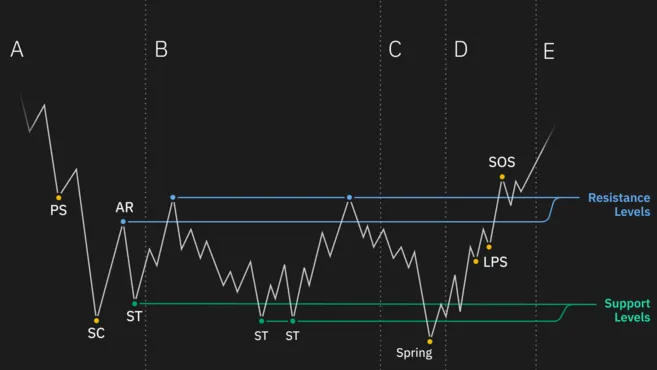
Phase A:
- Selling pressure decreases and the downtrend begins to slow.
- Volume increases and preliminary support (PS) appears, indicating that it is not yet enough to stop the decline.
- A selling climax (SC) occurs, with panic selling forming large candlesticks and wicks.
- After the panic selling, a quick rebound, or automatic rally (AR), takes place. The price moves around the selling climax and the automatic rally.
- A secondary test (ST) occurs when the market drops near the previous low, testing whether the downtrend has ended.
Phase B:
- This is the sideways phase, where the Composite Man accumulates the most assets.
- The market tends to test both resistance and support.
- Phase B may include numerous secondary tests (ST), and in some cases bull traps and bear traps may form at the lows and highs of Phase A.
Phase C:
- In Phase C of the accumulation chart, something called a spring occurs. This is when the market makes a lower low, forming one last bear trap.
- In Phase C, the Composite Man draws out as much selling as possible and shakes out most of the small retail investors.
- The spring often breaks below the last low, and it can then become the final support point.
Phase D:
- This ties into the law of cause and effect. It is the stage that prepares the sideways range (Phase C) and the upward breakout (Phase E).
- Volume and volatility increase significantly, and the LPS (last point of support) forms. This is the last window to buy shares at a lower price before the uptrend begins.
- If the LPS is tested and the previous resistance is broken, it becomes the new support.
Phase E:
- This is the final phase of the accumulation schematic.
- Volume rises sharply and the uptrend begins.
This accumulation schematic helps you understand market flow and identify market trends. Traders can analyze these schematics to make investment and trading decisions suited to the situation.
2. Pre-Decline Distribution Chart (Distribution)
The Wyckoff distribution (selling) schematic is the opposite of accumulation (buying) and follows a slightly different flow. The distribution schematic can be explained as follows.
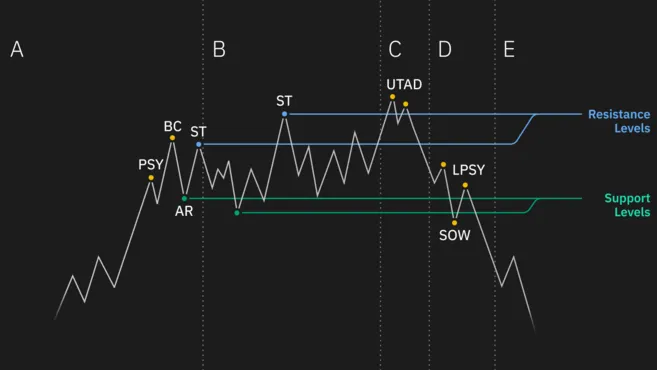
Phase A:
- The existing uptrend begins to slow as demand decreases.
- Preliminary supply (PSY) is not strong enough to stop the rally, but it signals that selling pressure is emerging.
- Excessive buying causes a buying climax (BC), with inexperienced traders getting swept up in emotion and buying.
- Excessive demand during the uptrend leads to an automatic reaction (AR).
- The Composite Man begins selling his holdings to buyers who jumped into the market late.
- A secondary test (ST) occurs when the market revisits the buying climax zone, creating a higher high.
Phase B:
- Phase B of distribution is the sideways range (cause) that precedes the downtrend (effect).
- The Composite Man gradually sells off his assets, weakening buying pressure in the market.
- The upper and lower bands are tested several times, and short-term drops and bull traps can occur.
- At times, the market may move above the resistance created by the earlier buying pressure, showing an upthrust (UT).
Phase C:
- After the market moves sideways, it may show one final bull trap. This is called a UTAD, or upthrust after distribution. It is essentially the opposite of the spring before a rally.
Phase D:
- Final buying enters the price range, but the lows keep getting lower.
- At this point, the price falls to around or below the support line.
- When the market breaks below support, a clear sign of weakness (SOW) appears.
Phase E:
- This is the final phase of distribution and marks the start of a full-fledged downtrend.
- Supply outweighs demand, so the support line breaks and the price falls further.
This distribution schematic describes the market flow as it turns into a downtrend. Traders can analyze these schematics to make investment and trading decisions suited to the situation.
Is the Wyckoff Method Really Useful?
The Wyckoff Method is one of the techniques widely used among many investors and traders, and it is recognized as a reliable technique. We can apply buying and selling strategies matched to the Wyckoff accumulation and distribution zones, as shown below.
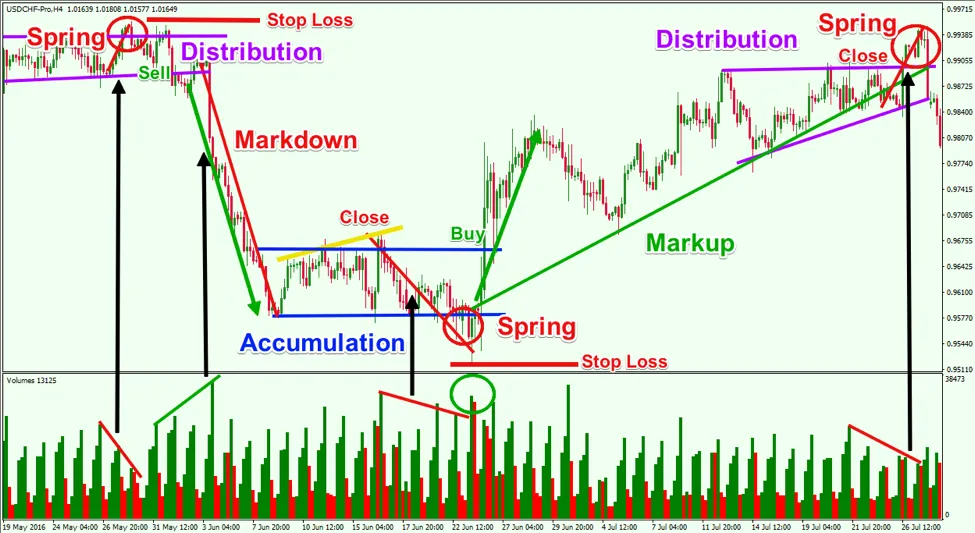
However, the Wyckoff Method is not always accurate. The market is essentially unpredictable and often moves in directions other than expected. For this reason, the Wyckoff Method is usually used together with various other technical analysis tools.
🪽 4 Recommended Technical Indicators
Wyckoff's 5-Step Approach
Wyckoff also developed a 5-step approach to the market. With it, investors and traders can work out the timing of their market entry.
- Step 1: Identify the trend
What is the current trend, and where is it likely to go? What does the relationship between supply and demand look like? - Step 2: Determine the asset's strength
How strong is the asset compared to the market? Is it about the same? Or is it moving in the opposite direction? - Step 3: Identify a sufficient cause
Is there enough reason to enter a position? Is the cause strong enough that the potential reward (effect) is worth the risk? - Step 4: Assess the likelihood of a move
Is the asset ready to move? Where does the position stand within the larger trend? What do price and volume suggest? - Step 5: Decide the entry timing
Are you ready? If so, enter.
Wyckoff's 5-step approach is especially effective for assets that move together with the market or an index. However, in crypto markets such as Bitcoin, this correlation doesn't always hold, so case-by-case judgment can matter more.
Final Summary
The Wyckoff Method encompasses many principles and theories and offers a comprehensive analysis of trading. It is a great help in enabling investors and traders to minimize emotional influence and make more logical, well-planned decisions.
However, whether it's the Wyckoff Method or any other technical analysis method, every investment always carries risk, so never forget that there is no such thing as a 100% certain prediction. That's why you should always approach investment decisions carefully and cautiously.
Finally, great traders each have their own distinct investment style. So it's important to build your own strategy that fits your investment goals. The Wyckoff Method is one of the proven trading strategies, but it's best to approach it flexibly according to your own situation and goals.


